Economy
Five Major Takeaways From The Latest Household Consumption Expenditure Data
Krishna Dange
Feb 26, 2024, 05:56 PM | Updated Feb 27, 2024, 12:18 PM IST
Save & read from anywhere!
Bookmark stories for easy access on any device or the Swarajya app.
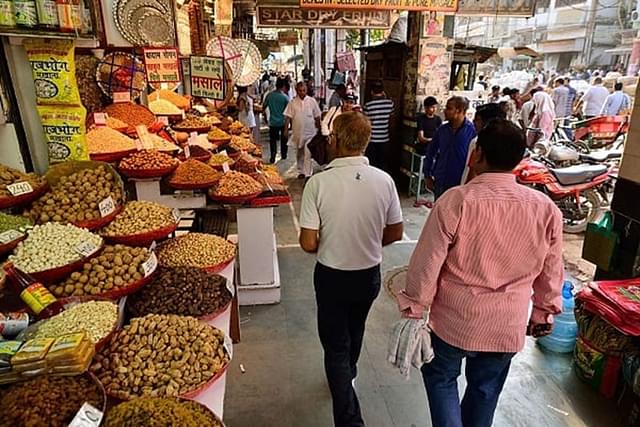
The National Sample Survey Office (NSSO) in its recent edition of ‘Household Consumption Expenditure Survey (HCES) 2022-23’ has noted an uptick in rural spending.
This can be inferred from the reduction in difference between rural and urban in terms of the average per capita expenditure to 71.2 per cent in 2022-23 as compared to 83.9 per cent seen in 2011-12.
In absolute terms, the survey noted the average monthly per-capita expenditure (MPCE) in the rural category for 2022-23 at Rs 3,773, up from Rs 1,430 seen in 2011-12. The same for the urban category was seen at Rs 6,459 in 2022-23, sharply up from the average per capita spending observed at Rs 2,630 seen in the same base year.
The survey report prepared by NSSO is released by the Ministry of Statistics and Programme Implementation (MoSPI) after every five years. However, the latest set of data comes after 10 years as the same for 2017-18 wasn’t released by the government owing to vast variance seen in the figures.
Notably, this document is said to be of crucial importance as it helps policy makers gauge the demand for different food and non-food items, purchasing power of households across different social categories and alternatively determine the inflationary pressures on the economy.
Here are the five key takeaways from the latest HCES for 2022-23:
1. Increase in discretionary spending across urban as well rural categories.
The consumption expenditure survey has observed that the share of spending on ‘non-food items’ in the rural category rose to 53.6 per cent in 2022-23 against 47.1 per cent observed in 2011-12. In the case of urban households, the share of expenditure under the same category rose to 60.8 per cent in the recent survey year as against 57.38 per cent seen 2011-12.
The percentage share of expenditure on durables, a major component of the ‘non-food items’, was seen up at 6.89 per cent from 4.85 per cent in the rural category. Where as the same in urban category was seen up at 7.17 per cent from 5.60 per cent in the urban segment for the survey period.
According to the experts, this sharp rise in discretionary spending in the rural household has been possible due to a decline in spending over items that are a part of the ‘food’ category.
Alternately, this also proves the perception of spending power of rural households to have reduced to be incorrect.
2. Decline in share of cereals and pulses in the overall spend over food
The report has observed a sharp decline in the spend over major food items like cereals and pulses against other items part of the food basket. This has been seen across rural as well as urban categories.
In the rural category, the percentage share of spend over cereals (like wheat, rice, barley) was seen at 4.89 per cent in 2022-23 against 10.69 per cent seen in 2011-12 as a part of overall the monthly per capita expenditure. The same in urban category, was seen at 3.62 per cent for 2022-23 as compared to 6.61 per cent seen in 2011-12.
In terms of the overall spend on food items, the share of average monthly per capita expenditure on food as a part of the overall MPCE, has reduced to 46.4 per cent in 2022-23 against 52.9 per cent in 2011-12 in rural category. The same for urban category was seen at 39.2 per cent as compared to 42.62 per cent in the same period.
According to several policy observers, the decline in spend over cereals in the rural category in particular has been due to the implementation of the National Food Security Act, 2013. As of now, 35 kilograms of foodgrains are provided free of cost to each prioratised household under the Pradhan Mantri Garib Kalyan Anna Yojana (PMGKAY).
3) Rise in spend over milk, meat and processed foods
The survey notes a steady rise in the share of spend over milk, meat and processed foods in terms of the overall spend over food. This has been observed across rural as well as urban categories.
This rise in particular has been more in the rural category. The share of spend over milk, meat and processed foods as a part of the overall MPCE in this category has increased to 8.33, 4.91 and 9.62 (all in per cent) respectively in 2022-23 as compared to 8.04, 4.79 and 7.90 (all in per cent) noted in 2011-12.
Experts have observed that availability of more spendable money owing to the food-security benefits also means increasing inclination towards high nutrition foods among the lower and middle income groups.
4) Sikkim tops among states with highest MPCE across rural and urban, lowest in Chhattisgarh
The north-eastern state of Sikkim emerged as the state with the highest MPCE across the rural as well as urban categories. In the rural category, MPCE for the state was seen at Rs 7,731 while the same for the urban was recorded as Rs 12,105.
According to the experts, this has been possible due to Sikkim also having topped the list of states with the highest per capita income at Rs 472,543 in the year 2021-22.
On the other hand, Chhattisgarh emerged as the state with the lowest average monthly per capita spend across rural and urban categories. The MPCE for the state in rural category was seen at Rs 2,466 while that in the urban category was noted as Rs 4,483. The rural-urban difference in average MPCE was also the highest in Chhattisgarh at 82 per cent only after Meghalaya at 83 per cent.
5) Share of spend among non-agriculture earners in rural more than those in agriculture
The report observed that those who were self-employed in non-agricultural professions in rural areas had more spending power than those engaged solely in agriculture.
The average MPCE for those who identified as ‘self-employed in agriculture’ stood at Rs 3,702, lower than the overall MPCE for the rural areas. On the other hand, the average MPCE of those who identified themselves as ‘self-employed in non-agriculture’ was seen at Rs 4,704.
In terms of the social categories such as Scheduled Tribe, Scheduled Caste, Other Backward Class and the unreserved, the average MPCE for all social categories was found to be higher in urban areas than their counterparts in the rural category.
Save & read from anywhere!
Bookmark stories for easy access on any device or the Swarajya app.
Staff Writer at Swarajya
Introducing ElectionsHQ + 50 Ground Reports Project
The 2024 elections might seem easy to guess, but there are some important questions that shouldn't be missed.
Do freebies still sway voters? Do people prioritise infrastructure when voting? How will Punjab vote?
The answers to these questions provide great insights into where we, as a country, are headed in the years to come.
Swarajya is starting a project with an aim to do 50 solid ground stories and a smart commentary service on WhatsApp, a one-of-a-kind. We'd love your support during this election season.
Click below to contribute.