Analysis
Only 12 Per Cent Of Indian Cities And Towns Have Air Quality Monitoring Stations: CSE Study
- CSE’s assessment has analysed the adequacy of the air quality monitoring network and air quality data, spatial spread, population coverage and data completeness in the country.
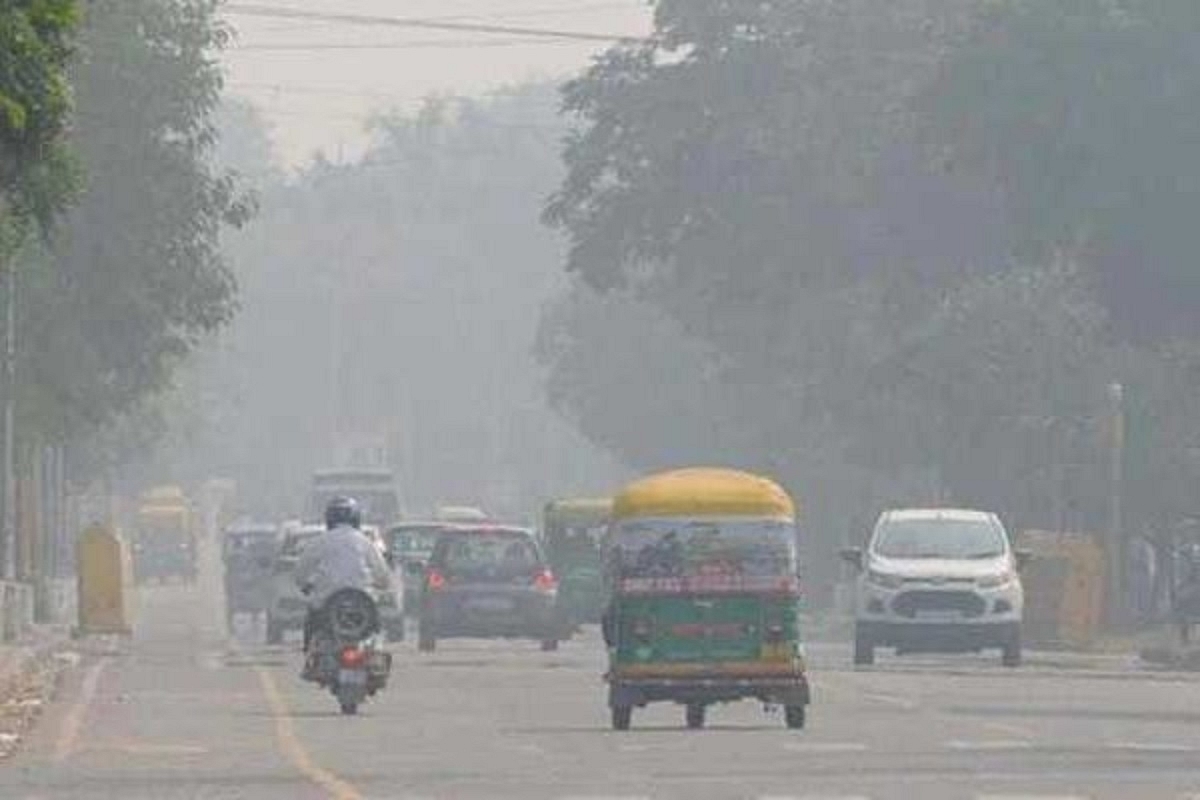
The analysis points out that nearly 47 per cent of the country’s population remains outside the maximum radius of the air quality monitoring grid. (Representative image).
Of India’s 4,041 census cities and towns, a mere 12 per cent have air quality monitoring systems and only 200 of these cities monitor all six key criteria pollutants, says an analysis.
This is when compliance with the National Ambient Air Quality Standards (NAAQS) and clean air targets under the National Clean Air Programme (NCAP) requires robust air quality monitoring.
The analysis by Centre for Science and Environment (CSE) released on 6 July has laid bare this abysmal state of the country’s air quality monitoring network.
The analysis points out that this means nearly 47 per cent of the country’s population remains outside the maximum radius of the air quality monitoring grid (manual and real time combined), while 62 per cent is outside that of the real time monitoring network.
"Limited air quality monitoring makes it challenging to identify non-attainment status of a vast number of towns/cities and regions and also impedes effective evaluation of clean air action and improvement in air quality needed for evaluation of performance of clean air action, especially under the 15th Finance Commission grant.
"More harmful particulate matter (PM) 2.5 and ozone are not considered for compliance under NCAP due to limited monitoring and data. It is necessary to ensure more equitable distribution of monitors and adoption of hybrid monitoring with a standardised and certified air sensor network and satellite-based monitoring with appropriate protocols for maximum and cost effective coverage of population to support action," says Anumita Roychowdhury, executive director, research and advocacy, CSE.
"The current urban monitoring grid is highly concentrated in a few big cities and there are vast areas in other regions with no monitoring," says Avikal Somvanshi, senior programme manager, Urban Lab, CSE.
"This needs to be rationalised to cover a wider population and habitats to support implementation of clean air action plans, provide information to public about the daily risks and design emergency response and longer term action,” adds Somvanshi.
The Methodology
CSE’s assessment has analysed the adequacy of the air quality monitoring network and air quality data, spatial spread, population coverage and data completeness in the country.
This has considered both manual monitoring under the National Air Quality Monitoring Programme (NAMP) and real time monitoring under the Continuous Ambient Air Quality Monitoring System (CAAQMS).
The key focus is on adequacy and completeness of the PM 2.5 data.
The study covers 883 manual stations and 409 real time stations. It has accessed and analysed publicly available data from the websites and publications of Central Pollution Control Board (CPCB) as of 31 December, 2022.
The extent of population coverage by the monitoring grid and the population estimates are based on the 100 m x 100 m spatial distribution of population in 2020, developed by the world population research programme of the School of Geography and Environmental Sciences, at the University of Southampton.
Air quality reported by a station is understood to be accurate representation of ambient air in its 2-km radius, while it can also be fairly representative of a 2-10 km radius around the station.
Without major topographical or human-made features the air quality reported at a station can also be a good proxy for ambient air for 10-50 km around the station.
Key Findings
Number of manual monitoring stations has doubled since 2010:
There were 411 manual stations operating in 2010. According to the CPCB website, currently, there are 883 operating manual stations in 379 cities/towns in 28 states and seven union territories of the country.
Only 476 of 4,041 cities/towns have air quality monitoring stations (manual or real time): A majority of these (267 cities) have manual stations; 98 cities have only real time stations; and 111 cities have both manual and real time stations.
Air quality monitoring grid falls short of the recommended guidelines:
The monitoring capacity as of 1 January, 2023 barely adds up to 6-8 per cent of the minimum recommended as per the guidelines of the Indian Standard 5182 methods for measurement of air pollution-part 14.
Cities with their population in the range of 100,000 and a million need 2,417 PM, 1,863 sulphur di-oxide (SO2) and 2,417 nitrous oxide (NO2) monitors and 525 monitors for carbon monoxide (CO) and surface ozone, each.
The requirement for small towns with population less than 100,000 is staggering and adds up to 14,172 PM, 10,629 SO2, and 10,629 NO2 monitors, besides 3,543 monitors for CO and surface ozone, each.
What is available is miniscule in comparison. India has only 1,187 PM10 monitors, 717 PM2.5 monitors, 1,161 SO2 monitors, 1,185 NO2 monitors, 406 CO monitors and 396 surface ozone monitors. A lot more will have to be added if the rural population is also considered.
About 47 per cent of Indian population or about 655 million people live outside 50 km radius of the air quality monitoring stations (NAMP and CAAQMS combined).
Only 4 per cent of the population or about 50 million people live within the immediate coverage zone of 2 km radius of the monitoring stations; 15 per cent lives in the 2-10 km radius; and about 34 per cent lives in 10-50 km radius.
Only Chandigarh, Delhi and Goa have full population coverage under the combined monitoring network:
In Delhi, 26 per cent of the population lives within a 2-km radius of its 40 real time and 10 NAMP monitoring stations; 100 per cent of the population is within the 50-km radius.
Chandigarh has the second best coverage with 40 per cent of its population residing within the 2-km radius of its eight manual and real time monitoring stations and 100 per cent within the 50-km radius.
Haryana is able to cover 95 per cent of its population within the 50-km radius of its monitoring grid. No other state or union territory has over 90 per cent population coverage.
About 860 million people live outside the 50-km radius of real time air quality monitoring stations (CAAQMS only) — which means they do not receive the daily AQI-based health alerts.
Only 2 per cent of the population lives in the immediate coverage zone (2-km radius) of real time monitoring stations; 11 per cent is within 2-10 km radius, and about 25 per cent within 10-50 km radius.
Manual stations are mandated to monitor SO2, NO2, PM10 and PM2.5. Real time stations usually monitor six pollutants — SO2, NO2, PM10, PM2.5, CO and ozone. Many stations do not monitor all the pollutants.
Over 100 manual monitoring stations have been added since 2020, but their data is not in the public domain.
As per available data from CAAQMS stations (updated as of 1 January, 2023), 199 cities are capable of monitoring all six criteria pollutants. Eight cities monitor only five pollutants (barring PM2.5); 102 cities monitor four pollutants — they do not have CO and O3 monitors; 161 monitor three pollutants — they do not monitor CO, O3 and PM2.5. There are six cities that monitor only one or two pollutants.
Only 43 districts have their whole population monitored for all six criteria pollutants:
Considering the combined coverage of NAMP and CAAQMS networks, only 43 districts have 100 per cent of their pollution within the 50-km radius of each of the six criteria pollutant monitors.
These districts are mostly located in Delhi-NCR. There are 237 districts where PM10 monitoring covers more than 75 per cent of the population within the 50-km radius of the combined monitoring networks.
The number falls to 173 districts for PM2.5 monitoring. Monitoring of SO2 and NO2 covers over 75 per cent of the population within the 50-km radius of the combined monitoring networks in 235 districts and 236 districts, respectively.
Numbers are much lower for CO and surface ozone monitoring, as it is only done under the CAAQMS network. For CO and ozone, 75 per cent or more population coverage is limited to 134 and 129 districts, respectively.
Way Forward
Air quality monitoring is important for assessing the status of growing risk and the impacts of clean air action on air quality.
It is also instrumental for informing people and vulnerable communities about the daily pollution levels; enabling emergency and long-term action; and supporting health impact studies.
The CSE analysis recommends the following way forward to bolster the monitoring systems:
More equitable distribution of reference-grade regulatory air quality monitoring stations for wider population coverage and for reaching areas that are without a monitoring network.
Expand monitoring network for pollutants that pose higher public health risk — PM2.5 and ozone.
Implement framework for hybrid air quality monitoring system that combines a network of regulatory monitors with air sensors and satellite-based monitoring — but based on proper standardisation, certification, calibration requirements and detailed protocols.
Support Swarajya's 50 Ground Reports Project & Sponsor A Story
Every general election Swarajya does a 50 ground reports project.
Aimed only at serious readers and those who appreciate the nuances of political undercurrents, the project provides a sense of India's electoral landscape. As you know, these reports are produced after considerable investment of travel, time and effort on the ground.
This time too we've kicked off the project in style and have covered over 30 constituencies already. If you're someone who appreciates such work and have enjoyed our coverage please consider sponsoring a ground report for just Rs 2999 to Rs 19,999 - it goes a long way in helping us produce more quality reportage.
You can also back this project by becoming a subscriber for as little as Rs 999 - so do click on this links and choose a plan that suits you and back us.
Click below to contribute.
Latest