Economy
Global Oil Prices And Fraud Explain Most Of The Divergence Between UPA And NDA Export Performance
- The really sad part of the export story is not UPA or NDA performance, but India’s basic lack of competitiveness in most areas, barring software services.
- That is what we need to fix. Pretending that UPA did well or that NDA is now doing better will not help.
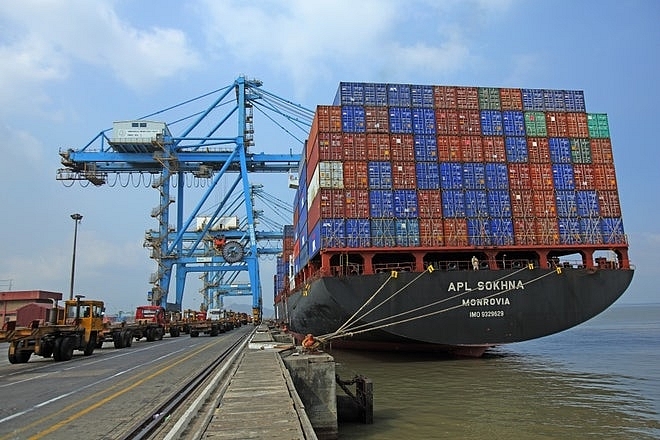
The reason why the UPA period recorded high export growth was high prices of global crude. (GettyImages)
On 15 April, Commerce Minister Suresh Prabhu announced 9 per cent growth in merchandise exports to $331 billion in 2018-19, and a similar rise in imports to $507 billion, thus giving us a trade deficit – before counting services exports – of $176 billion. After accounting for services, the deficit falls to just over $80 billion.
While last year’s growth looks reasonable in the context of anaemic growth in the earlier Narendra Modi years, and especially compared to the boom-boom years of the UPA, the sober reality is this: India’s high export performance during the UPA period, and its relatively weak performance during the NDA period can be substantially explained by just one item (petroleum-products) and one faulty policy (forced subsidisation of prices at home).
The reason why the UPA period recorded high export growth – ranging from 20-40 per cent in most years, with 2010-11 peaking at 40.49 per cent – was high prices of global crude and the global trade boom in 2004-08. Since this period was accompanied by high subsidies on locally sold petro-products, the two private sector companies who were not forced to sell at a discount – Reliance Industries and Essar Oil – exported almost the whole of their produce. Net result: exports boomed.
In 2010-11, Reliance’s exports zoomed 33 per cent to $33 billion over the previous year, most of it being petro-fuels. Seven years later, in 2017-18, Reliance’s exports were actually lower at $27 billion, again due to lower global petroleum prices. Reliance’s export performance shifts explain a large part of the India export story.
When oil prices peaked in 2013-14 and the first half of 2014-15, the share of India’s petro-goods (petroleum, oil and lubricants) in total exports was as high as 20 per cent. When they bottomed out in 2016-17, the share was down to 11.7 per cent (see some details from the last Economic Survey here). In 2018-19, as global oil flared up again, crossing $80 a barrel some months ago, the share of petro-product exports has again crossed 15 per cent (April 2018-January 2019). This explains a large part of the revival in export growth last year.
The magnitude of the contribution of petro-fuels to the export basket can be guaged from figures for two specific years: In 2014-15, the last year of the export boom, petro-fuels exports clocked $58 billion. In 2016-17, this was down to $32 billion. A shift of over $25 billion in just one export product group.
The reason why private players were exporting like crazy, often at half the domestic price, was a UPA policy decision to force public sector oil companies to subsidise domestic prices, while private players were free to sell at a profit abroad. The export prices were far lower and still profitable for Reliance and Essar Oil because most other countries do not tax petro-fuels as highly as India does.
Put another way, while India bled its public sector oil companies dry, it allowed its private players – Mukesh Ambani and the Ruia brothers – to sell at slim, but profitable, margins in overseas markets.
The other reason why India’s export performance during the UPA years looked rosier was plain and simple over-invoicing. Post-2008, domestic businesses were given a fiscal boost through a sharp cut in service and excise taxes. But as a fiscal crisis loomed, these sops began to be withdrawn, and some domestic businesses made up the revenue gap by bringing in illegally held foreign stashes of cash by the simple expedient of over-invoicing exports. The mounting global pressure on tax havens aided this trend.
In 2010-11, for example, the initial export data showed a whopping 79 per cent growth in engineering exports from $38 billion in the previous year to $68 billion – a pole-vault of $30 billion in one year. But engineering companies in the BSE 500 showed a rise of only 11 per cent, or less than $2 billion. Where did the remaining $28 billion-and-odd come from? The small and micro units? Impossible.
A Kotak Securities report on 2010-11 pointed out two “egregious” examples of inflated export claims. Exports of metal and metal products soared from $13 billion to $ 29 billion – a rise of $16 billion in one year. But actual exports by the big boys in the BSE 500 showed a rise of only $1 billion or thereabouts. “Copper articles” exports soared over four-fold from Rs 8,500 crore to Rs 36,700 crore. These export miracles are difficult to explain except by presuming some generous amount of over-invoicing by exporters.
The really sad part of the export story is not UPA or NDA performance, but India’s basic lack of competitiveness in most areas, barring software services. That is what we need to fix. Pretending that UPA did well or that NDA is now doing better will not help.
Support Swarajya's 50 Ground Reports Project & Sponsor A Story
Every general election Swarajya does a 50 ground reports project.
Aimed only at serious readers and those who appreciate the nuances of political undercurrents, the project provides a sense of India's electoral landscape. As you know, these reports are produced after considerable investment of travel, time and effort on the ground.
This time too we've kicked off the project in style and have covered over 30 constituencies already. If you're someone who appreciates such work and have enjoyed our coverage please consider sponsoring a ground report for just Rs 2999 to Rs 19,999 - it goes a long way in helping us produce more quality reportage.
You can also back this project by becoming a subscriber for as little as Rs 999 - so do click on this links and choose a plan that suits you and back us.
Click below to contribute.
Latest