Economy
The Big Fuss Over Revision Of IIP and WPI Explained
- Calculating the new indices is a highly technical and econometric exercise involving several experts and an army of statisticians.
- So, there is no stopping insinuations that the data may be dodgy.
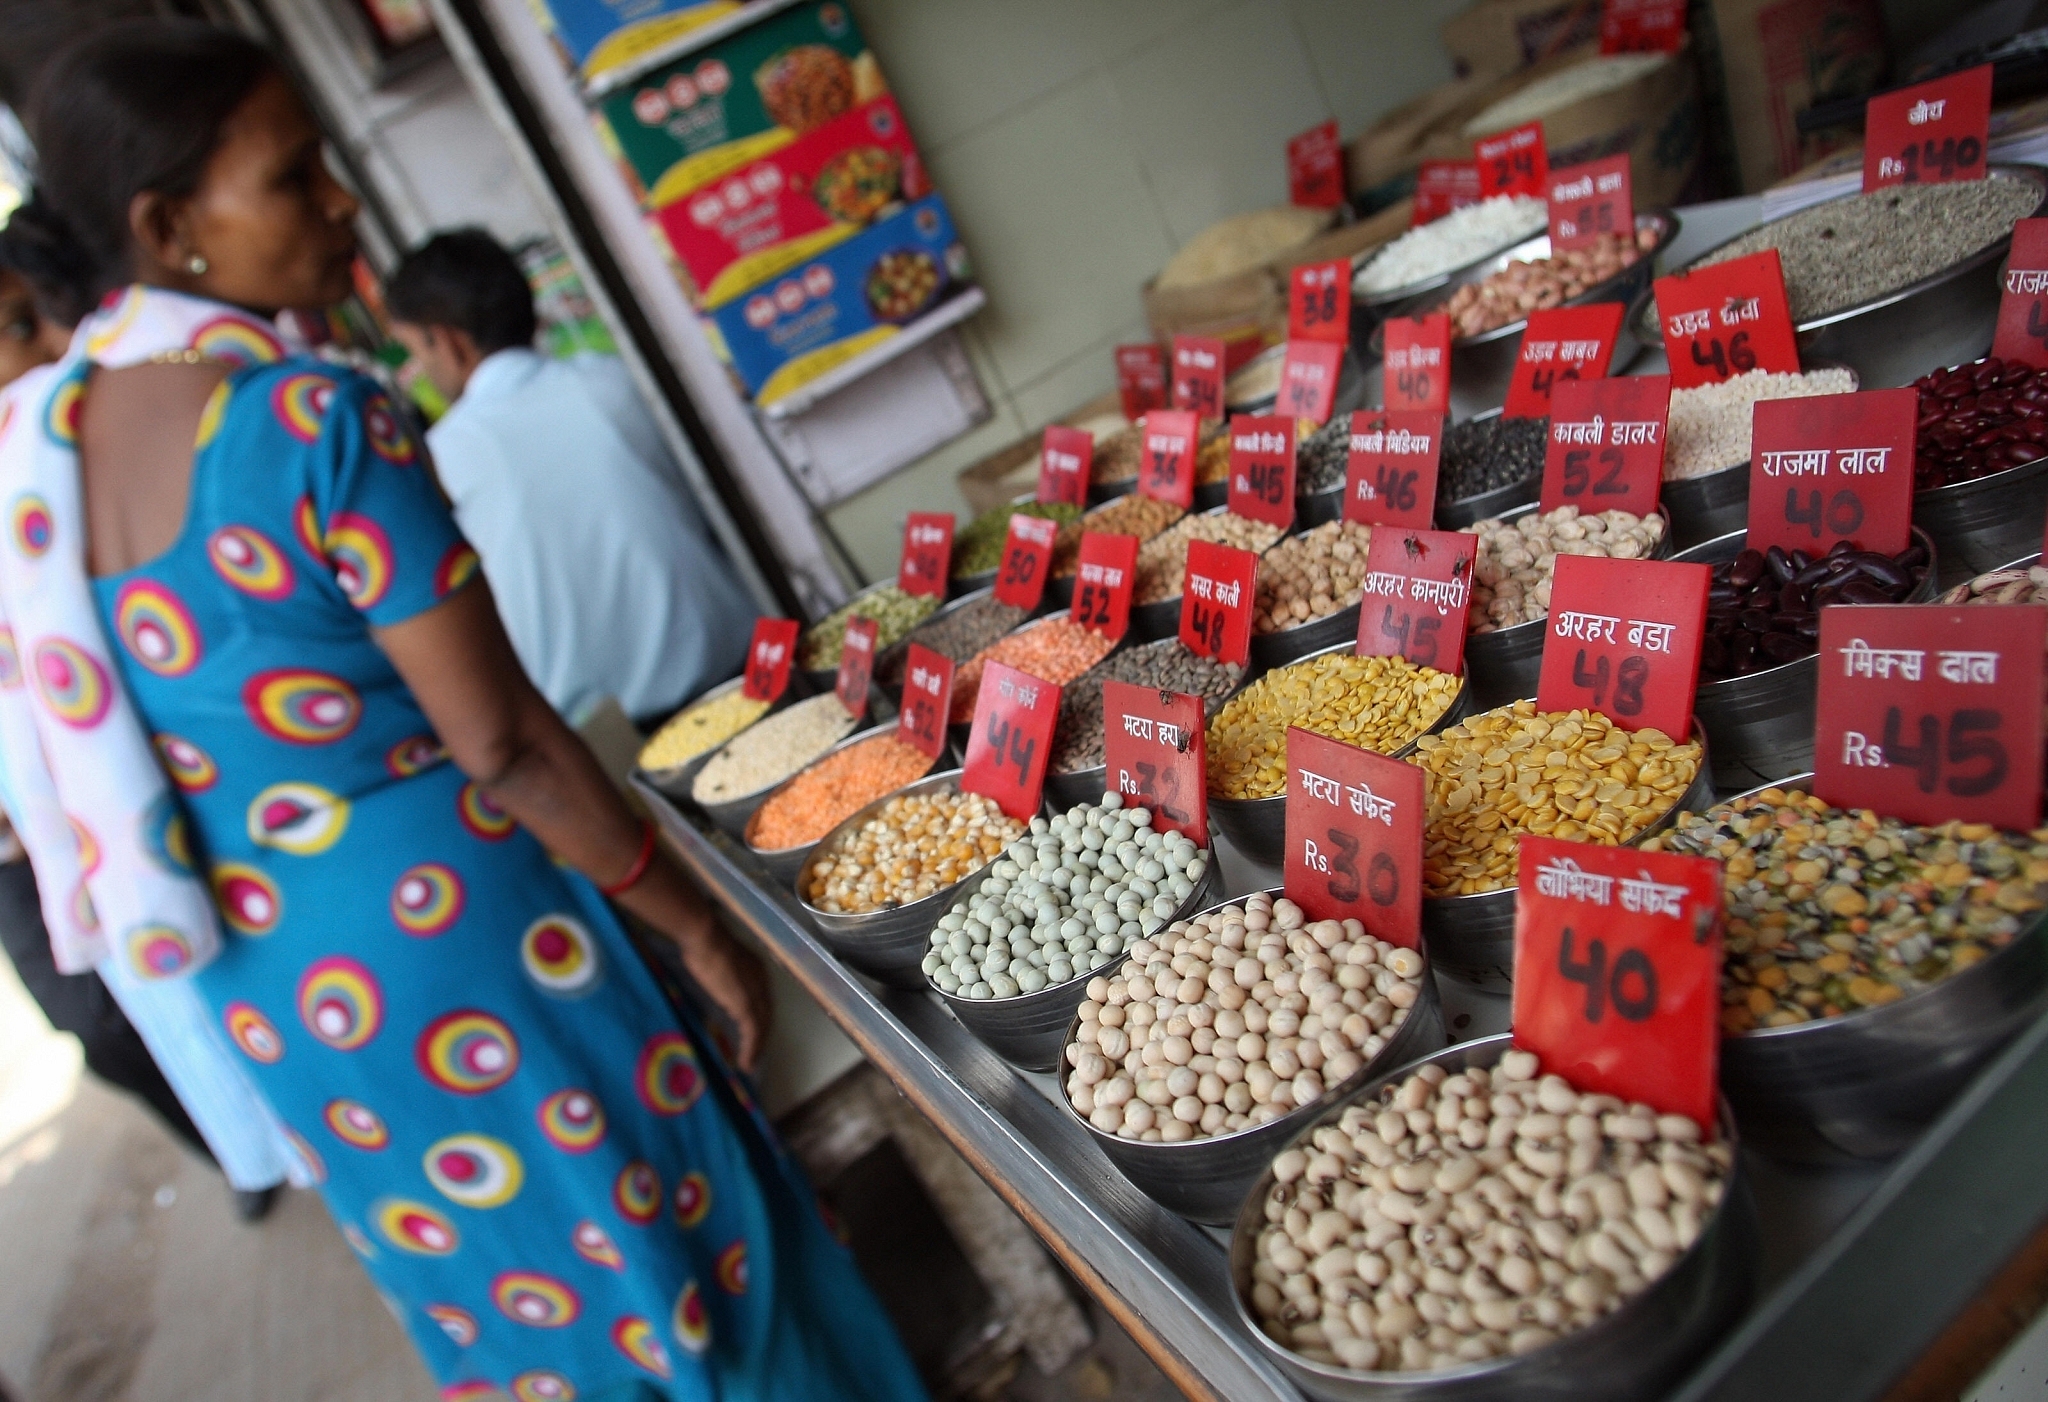
An Indian woman checks the price of pulses and grains at a wholesale market in New Delhi. (MANAN VATSYAYANA/AFP/GettyImages)
What’s the big fuss over the revisions in the index of industrial production and wholesale price index?
Both these indices were hopelessly outdated and out of sync with other economic indicators. The base year in each of these two was 2004-05; it was 2011-12 in the case of the others. The basket of goods they were based on was also obsolete. And that led to problems.
Remember the noise over the dissonance between the index of industrial production (IIP) data and gross domestic product (GDP) data on industry every quarter? This was mainly (but not solely) because the base year of the IIP was 2004-05, reflecting the basket of goods of that year, many items in which are probably not being produced any more. There may have been cases where factories from where data was supposed to come had shut down, leaving a black hole in statistics.
The WPI is used as a GDP deflator and working with an outdated index can lead to distortions. It can, notes N Bhanumurthy of the National Institute of Public Finance and Policy (NIPFP), show real GDP as higher than the nominal GDP.
Given changes in the economy, both the base year and the basket of goods of economic indices need to change regularly, generally every five years. The base year in the new series should have been 2009-10 (since the earlier base year was 2004-05), but that was an outlier year for the economy because of the global financial crisis the previous year as well as severe drought conditions. The base year should be a normal year and so it was decided to have 2011-12 as the new base year. This was also the rationale behind base year change in the case of GDP to 2011-12.
Importantly, a technical review committee, chaired by the secretary, Ministry of Statistics and Programme Implementation (MOSPI), will be set up to regularly review the commodities basket and suggest deletions and additions, if warranted, during the course of the current series. This will ensure that the index does not get outdated till it is time for the next base year change. T C A Anant, current secretary, MOSPI, said the committee will undertake the review at least once a year. Changes may not happen every year, though, but only when necessary.
The revisions are based on the recommendations of a working group headed by Saumitra Chaudhuri, who was a member of the Prime Minister’s Economic Advisory Council constituted by Manmohan Singh as well as member, Planning Commission. The report was submitted in April 2014.
How is the composition of the basket of goods decided?
In the case of the IIP, which tracks production, the basket is based on traded volumes of goods in the base year. In the case of WPI, it is on the volume of goods consumed in the base year. Goods that have a very insignificant share in production and consumption get dropped and new ones reporting high volumes get added.
Weights are also assigned to individual items as well as the groups under which they are placed. The weight is based on the net traded value (the total transactions in a product) in the base year. Weights tend to change with the change in base year.
What are the big changes in the WPI?
A major conceptual difference between the old and the new series is the exclusion of indirect taxes while compiling indices. Earlier, the wholesale price was taken as producer price plus indirect taxes minus trade discount. Now, it will be producer price minus trade discount only. There are three reasons for this. One, netting out indirect taxes removes the impact of fiscal policy on prices and brings it closer to a producer price index (PPI), which India still does not have. This is also in line with global best practices.
Two, according to a note put out by the Department of Industrial Policy and Promotion (DIPP), which monitors the WPI, excluding indirect taxes from WPI makes it a compatible and appropriate deflator because the nominal estimates are computed at basic price which does not include product taxes.
Third, according to the note, the exclusion of indirect taxes will also ensure continuity of the WPI in the post-goods and services tax (GST) scenario. Under GST, the tax is levied at the final point of consumption; excise is levied at the production stage.
The revised WPI basket has 564 items against 555 earlier. As many as 199 items have been added and 146 items have been deleted; 498 items are common to the two series.
What’s in: a lot of new items under food: peas, radish, cucumber, bitter gourd, mosambi, pomegranate and jackfruit, tamarind, betel leaves, to name a few. Also natural gas, industrial wood, copper concentrate and lead concentrate.
What’s out: logs and timber, copper ore, gypsum, graphite, coke and light diesel oil.
Electricity will be tracked as one head; earlier it was tracked under five heads: domestic, commercial, agricultural, railways traction and industry.
Why is there a separate food price index within the WPI?
This has been done to monitor food inflation more closely and in line with the CPI, which has a separate food price index. The WPI was tracking food prices earlier, but this was done under two categories of food articles under primary articles and food products under manufactured products. Now there will be a combined sub-index within the WPI.
So what’s the wholesale inflation picture now?
Inflation under the new series comes out as lower than under the old series. For example, in 2016-17, the inflation rate was 3.7 per cent under the old series and only 1.7 per cent under the new series. This is true in the case of earlier years as well (the calculations go back to 2012-13). That’s also the case in primary articles, fuel and power and manufactured products. The main reason for this, apart from change in commodity basket and better reporting, is the netting out of indirect taxes.
Will the new index reduce the divergence between WPI and CPI?
That’s not clear. According to Bhanumurthy, one will have to wait and see how robust the new index is. He does not feel there will be too many errors in the new index but cautions against hype over WPI as a policy tool. “It is still a segmented index; it is not an economy-wide price index since it does not track services prices. The information it provides for policy making, especially monetary policy, will still be limited. It is just setting the stage for an eventual producer price index (PPI).”
What are the big changes in the IIP?
The number of items in the basket of goods is now 809 (in 407 item groups) against 620 items (in 399 item groups) in the old series. There are 149 new items; 124 items have been deleted. The weights have changed, with that of electricity going up and that of mining and manufacturing dipping.
What’s in: steroids and hormonal preparations, refined palm oil, cement clinkers, medical/surgical accessories and pre-fabricated concrete blocks.
What’s out: rice bran oil, flavoured milk, gutka, leather shoes, tooth brush, elastic tape, pens, calculators, battery charger, fans. (No, this doesn’t mean people have stopped brushing their teeth or wearing leather shoes; it’s just that the relative share of these in the trading basket may be insignificant.)
In the electricity segment, the new IIP has data on electricity from renewable sources, since that is growing in importance.
In the use-based classification, the basic goods category has been renamed primary goods. A new category, infrastructure/construction goods, has been added, reflecting the growing importance of the infrastructure and construction sector in the economy.
In capital goods, the data will capture `work in progress’, on the recommendation of the Chaudhuri working group. The report had noted that in the case of heavy machinery and other capital goods, the production of one unit may take several months and is reported only in the month when it is completed. This invariably caused lumpiness in data on capital goods, with growth being negative in one month and surging to double digits in the next. The report suggested a formula to factor in the ongoing production of capital goods to avoid such spikes.
The greater level of disaggregated data, Bhanumurthy notes, shows increased availability of such data and confidence about its robustness.
Will the changes in base year and basket of goods reduce the divergence with GDP data?
Not entirely, though the current stark dissonance will no longer be there. The IIP will still be just about production in the organised sector, while GDP will be tracking value added and also covering the unorganised sector. So GDP data on industry will not be mirroring quarterly IIP data.
What’s the picture the new index paints?
Well, industry seems to have done significantly better than was presumed. Against near stagnant growth of 0.7 per cent in 2016-17 under the old series, growth was 5 per cent under the new series. Manufacturing posted a 4.9 per cent growth under the new series against a decline of 0.1 per cent under the old series. Mining grew 5.3 per cent and electricity 5.8 per cent under the new series against 2.2 per cent and 4.7 per cent respectively under the old series.
Hmm, new WPI shows inflation lower than before and new IIP shows better industrial performance than before. Surely, this government is fudging figures again?
Well, this is a highly technical, econometric exercise involving several outside experts and an army of statisticians in MOSPI as well as the office of economic adviser in the DIPP. But there’s no stopping such insinuations. Ponder over this, though: the data shows the same picture for the last two years of the United Progressive Alliance government (2012-13 and 2013-14) as for the three years of this government – lower inflation and higher industrial output under the new series than under the old. Chew on that.
Introducing ElectionsHQ + 50 Ground Reports Project
The 2024 elections might seem easy to guess, but there are some important questions that shouldn't be missed.
Do freebies still sway voters? Do people prioritise infrastructure when voting? How will Punjab vote?
The answers to these questions provide great insights into where we, as a country, are headed in the years to come.
Swarajya is starting a project with an aim to do 50 solid ground stories and a smart commentary service on WhatsApp, a one-of-a-kind. We'd love your support during this election season.
Click below to contribute.
Latest