Insta
Irreversible Formalisation? ATM Vs UPI Value Graph In Economic Survey Suggest QR Codes Have Comprehensively Beaten Cash Machines
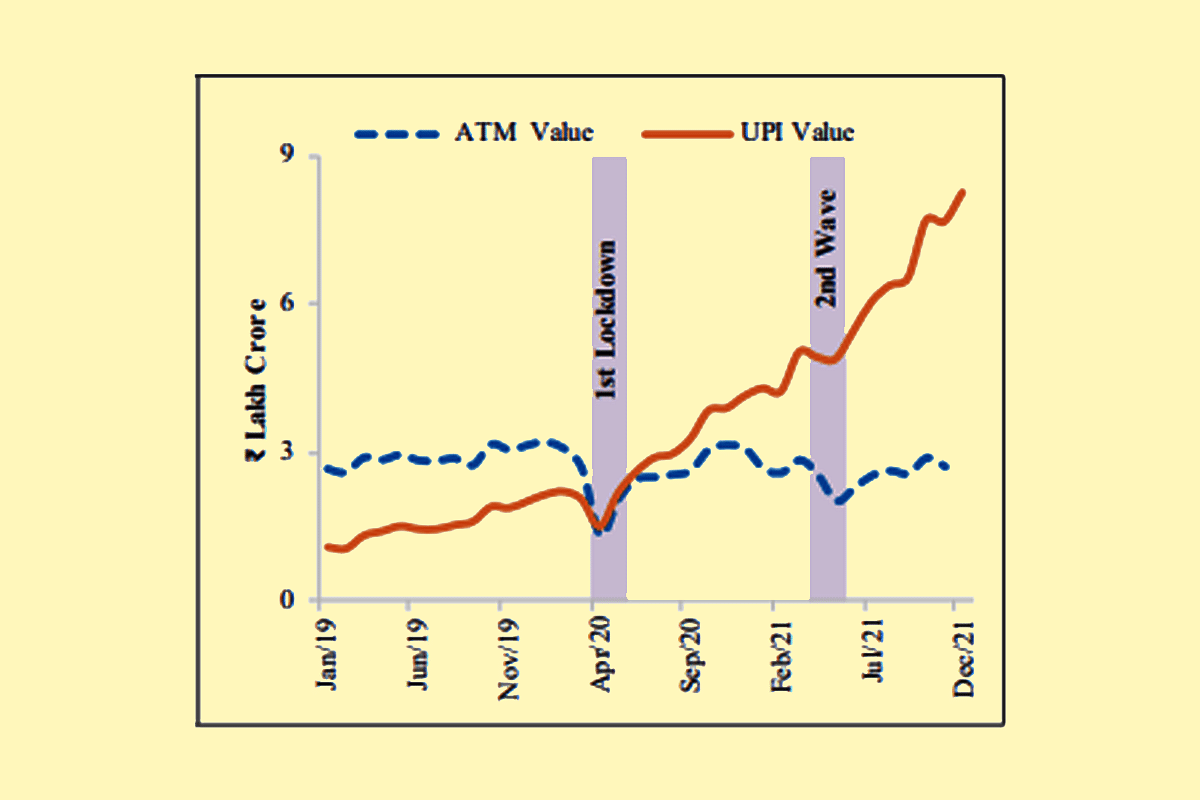
The UPI vs ATM transactions value graph
India will need fewer ATMs going forward, as UPI usage seems to have caught up firmly in the country.
This is what was apparent in the last graph of chapter 1 of the Economic Survey 2022.
According to experts, this graph suggests the following:
-One, ATM usage could not completely recover from the shock of the First Wave in April 2020.
-Two, it is around the same weeks that total value of UPI transaction exceeded the total value of ATM transactions and the gap has gone on increasing ever since.
-Three, the current gap between the two and their trends suggest formalisation of economy at a scale that cannot now be reversed.
Support Swarajya's 50 Ground Reports Project & Sponsor A Story
Every general election Swarajya does a 50 ground reports project.
Aimed only at serious readers and those who appreciate the nuances of political undercurrents, the project provides a sense of India's electoral landscape. As you know, these reports are produced after considerable investment of travel, time and effort on the ground.
This time too we've kicked off the project in style and have covered over 30 constituencies already. If you're someone who appreciates such work and have enjoyed our coverage please consider sponsoring a ground report for just Rs 2999 to Rs 19,999 - it goes a long way in helping us produce more quality reportage.
You can also back this project by becoming a subscriber for as little as Rs 999 - so do click on this links and choose a plan that suits you and back us.
Click below to contribute.
Latest