Magazine
Jobs, Jobs, Jobs!
- With jobs being created very slowly, and a million Indians entering the workforce every month, we are staring at an alarming future.
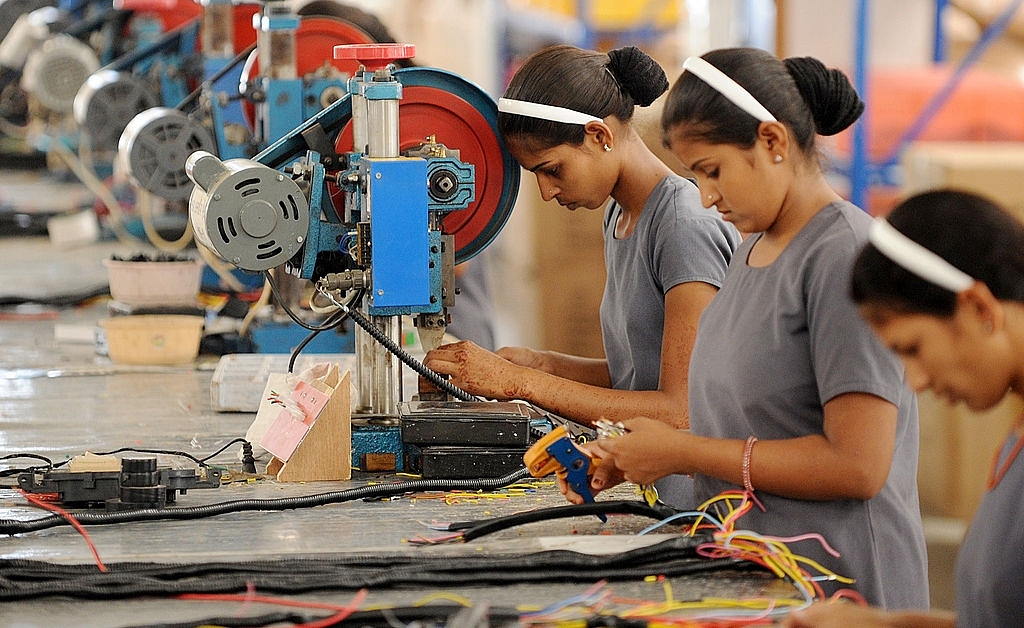
India manufacturing jobs (SAM PANTHAKY/AFP/GettyImages)
Haal chaal theek thak hai
Sab kuch theek thak hai
BA kiya hai, MA kiya
Lagta hai wo bhi aiwen kiya
Kaam nahi hai varna yahan
Aapki dua se sab theek thak hai
— Gulzar
I started working for a daily newspaper in October 2005. India, at that point of time, was experiencing multiple booms. One of the booms was in the new equity mutual fund schemes that were being launched.
As someone who had been hired to write on personal finance, I was expected to attend these new fund launches and then write analytical pieces around the same. At its peak, there was almost one new equity mutual fund being launched every week.
On most occasions, there was nothing different about a new equity mutual fund scheme in comparison to the schemes already operating in the market. But then, when a boom is on, no one thinks about these things. The equity market had rallied for a few years, and investors were simply lapping up these new schemes.
Due to various reasons, asset management companies which run mutual funds have always found it easier to raise more money by starting new mutual fund schemes than by selling old ones which have been around for a while and have a performance track record.
In almost all of the presentations that were made on why investors should buy the new scheme, one reason that the fund managers offered was that the India growth story was still going strong. But no one ever bothered to explain what the India growth story actually was. In fact, for a while, I even thought that the fund managers were talking in some sort of code.
As John Lanchester writes in How to Speak Money: “Practitioners of almost every métier (i.e., profession), from plumbers to chefs to nurses to teachers to police, have a gap between the way they talk to each other and the way they talk to their customers or audience.”
Over a period of time, I realised that it was much more than that. As Lanchester writes: “There are a lot of things…in the world of money where the explanation is hard to hold on to because it compresses a whole sequence of explanations into a phrase, or even just into a single word.”
The India growth story was that kind of phrase. In three words, fund managers encapsulated a whole sequence of things they thought would lead to the Indian economic growth continuing to remain strong in the years to come. Or, if I were to look at it in a cynical sort of way, fund managers wanted to sound like other fund managers. I guess it was a bit of both.
Given the fact that I had no background in writing about these things, it took me a while to understand what the managers meant by the India growth story. While different fund managers meant different things, one common point that almost all of them talked about was India’s demographic dividend.
They felt that India’s coming demographic dividend would keep driving Indian economic growth. And what is demographic dividend, by the way?
The demographic dividend of a country is essentially a period of two to three decades when the birth rates go down, and this leads to a situation wherein the workforce of the country is growing at a faster rate in comparison to its population.
Sanjeev Sanyal explains this in his book The Indian Renaissance, where he defines three stages: “In the first stage, there is an increase in the proportion of the young in the population as birth rates stay high but infant mortality declines.” The infant mortality rate is essentially defined as the number of infants who die before reaching one year of age for every 1,000 live births during the course of a given year.
In the second stage, the birth rates come down. This happens primarily because once infant mortality comes down, people start to realise that their children will grow into adults. Hence, they have fewer of them. In the Indian case, the investment made by the government in urban as well as rural health missions has started to have some impact on India’s infant mortality rate. The infant mortality rate in India was 75 in 1996. It has come down to 38 in 2015, as data from World Bank shows.
Along with the infant mortality rate declining, the general technological advances as well as access to medical facilities have improved. This essentially means that, in the coming years, there will be a huge bulge in the number of young people in the country. In this stage, the workforce of the country increases dramatically. This is the demographic dividend. In the third and final stage, the working population falls and the number of old people goes up. This is something that the European countries and Japan are currently facing, and which China is likely to face in the years to come.
India is currently in the second stage. This basically means that the workforce of the country will grow dramatically in the years to come. What do the numbers look like? There are several projections that are available. Let me discuss a few here, starting with Sanyal, whom we have quoted above.
As Sanyal writes: “The UN’s projections suggest that India’s working age population will rise from 691 million in 2005 to 829 million in 2015 and 942 million in 2025 before stabilising at around 1,050 million in the late 2030s.”
So, as per Sanyal’s calculations, India will add around 113 million (942 million minus 829 million) to the workforce between 2015 and 2025. This means around 11 million (or 1.1 crore) individuals per year, on an average.
Akhilesh Tilotia comes up with a slightly higher number in his 2015 book The Making of India—Gamechanging Transitions. As he writes: “Over the next ten years, till 2025, 250 million people will be eligible to join the workforce…. This means that more than 2 million people will become eligible to work every month…. Around 12-15 million people will actively look for employment opportunities every year.”
Now how does two million eligible workers a month come down to around a million a month looking for a job? There are essentially two reasons for this. Not all Indian women work. Assuming that two-thirds of them do not look out for a job, the number of two million a month comes down substantially. Of course, if more women decide to join the workforce, then the number of one million per month will go up. Furthermore, around five to six million individuals will retire every year. Once we adjust for these factors, the eligible new workforce of two million a month comes down to an effective new workforce of one million a month.
There is another detailed study on this carried out by TS Papola and Partha Pratim Sahu of the Institute for Studies in Industrial Development. The authors estimate that “about 13 million employment opportunities every year” are needed “to generate productive employment to almost everyone looking for work”. The authors estimate that creating 13 million jobs a year would imply an employment growth rate of 3 per cent per year.
And then there is the estimate made by the Planning Commission for the 12th Five-Year Plan. As the 12th Five-Year Plan document points out: “One hundred and eighty-three million additional income seekers are expected to join the workforce over the next 15 years.” This essentially means that around 12 million (1.2 crore) individuals will join the workforce every year in the years to come. This works out to around one million a month. And at this rate, the Indian workforce is expected to be larger than that of China by 2030.
Basically, the four estimates vary, but almost all of them suggest that around a million Indians are entering the workforce every month. Sanyal suggests that 11 million Indians are likely to enter the workforce every year. Tilotia suggests a number of 12-15 million Indians entering the workforce every year. Finally, Papola and Sahu suggest a number of around 13 million. Hence, the numbers vary between 11 and 15 million Indians entering the workforce every year. And the 12th Five-Year Plan talks about around 12 million Indians entering the workforce yearly. Given this, it is safe to say that around a million Indians will enter the workforce every month in the years to come. This amounts to 1.2 crore Indians entering the workforce during the course of the year.
And this is India’s demographic dividend. As these individuals enter the workforce, find work, earn money and spend it, the Indian economy is expected to do well. At least, that is how things are supposed to work in theory. But are there enough jobs going around for these individuals who are currently entering the workforce and who will continue to do so for at least the next decade or so?
Before we get around to answering this question, it is important to ask how things have looked in the past. Between 1991 and 2013, the working age population in India increased by 30 crore. At the same time, the number of employed increased by only 14 crore, with the economy absorbing less than 50 per cent of the new entrants into the labour market. This shows the limited capacity of the Indian economy to generate employment. This is a serious challenge, given that the Indian labour force will continue to expand over the next few decades.
Let’s look at some data. In fact, let’s start with what the various arms of the government are doing as far as job creation is concerned. Take a look at Table 1. It shows the total number of employees working for the CPSEs (Central Public Sector Enterprises) as well as their salaries.
The number of permanent employees in the CPSEs was 16.1 lakh in 2006-2007. But by 2014-2015, this had fallen to 12.9 lakh. This essentially means that the CPSEs, on the whole, did not create any new jobs between 2006-2007 and 2014-2015. In fact, the number of jobs came down by around 20 per cent and has been steadily decreasing over the years.
Now how do things look for the central government employees? On 1 January, 2006, the central government had a sanctioned strength of 38.3 lakh. Against this, it had 32.7 lakh employees on its rolls. By 1 January, 2010, the sanctioned strength had gone up to 38.9 lakh, while the number of employees had fallen to 32.3 lakh.
By 1 January, 2014, the sanctioned strength had risen to 40.5 lakh, whereas the number of employees had risen marginally to 33 lakh. So between 2006 and 2014, the central government basically added around 28,000 jobs.
Let’s look at some more data. The number of people working in the public sector in India has come down over the years. The public sector includes people working in the central government, state governments, quasi-government bodies and local governments.
In 1991-1992, the year the economic reforms were initiated, the public sector employed close to 1.92 crore individuals. By 2011-2012 (the latest data that is available), it had fallen to 1.76 crore. So, over a period of two decades, the number of jobs in the public sector has come down by 16 lakh.
Interestingly, the number of jobs in the organised private sector between 1991-1992 and 2011-2012 went up from 78.5 lakh to around 1.2 crore. This basically meant an increase of 2.1 per cent per year. One reason for this has been the fact that the share of contract workers, essentially in the manufacturing sector, has gone up dramatically over the years. In 1995, contract workers made up for around 13 per cent of the manufacturing workforce. By 2011, this had jumped to 34 per cent. This increase in the number of informal workers has also led to a decline in the strength of the collective bargaining of the trade unions. This is also evident in the decline in the number of working days lost due to strikes.
Data released by the Chandigarh-based Labour Bureau in April 2016 suggests that no new jobs were created across eight labour-intensive sectors between October and December 2015. There was, instead, a decline of 20,000 jobs. This was the country’s worst performance on the job front since 2009.
The era when the government created jobs is long gone. Furthermore, this data clearly tells us that the formal sector hasn’t managed to create enough jobs for the one million Indians projected to join the workforce every month. Also, the public sector jobs data is more than four years old. This is one of the problems with trying to figure out the real employment scene in India. The data in some cases is simply too old.
Let’s look at some more recent data. Figure 1 shows the number of people working for the Haryana government during the years 2001-2014.
Between March 2001 and March 2014, the number of employees of the Haryana government went up from 3,19,027 to 3,40,698. This means an increase in jobs at the rate of 0.5 per cent per year over a 13-year period. This is far slower than the rate of population growth. Between 2001 and 2011, when the last two Censuses were carried out, the population of Haryana grew by 1.8 per cent per year, on an average.
Interestingly, the total number of people employed by the government of Haryana fell between 2001 and 2004. How do things look if we take March 2004 as the base year? The numbers of jobs then grew by around 0.9 per cent a year.
The point being made is that the number of Haryana government jobs has been growing at a very minuscule pace. The situation is similar at the central government level. But why are we talking about Haryana specifically here?
In May 2016, the Government of Haryana notified the Haryana Backward Classes (Reservation in Services and Admission in Educational Institutions) Act.
The Act provides 10 per cent reservation to the following castes—Jats, Jat Sikhs, Rors, Bishnois, Tyagis and Muslim Jats—in Class III and Class IV government jobs. It also provides a 6 per cent reservation in Class I and Class II jobs to these same castes. Furthermore, the Act provides a 10 per cent reservation to these castes for admission into educational institutes.
In February 2016, Jats had gone on an agitation, resorted to violence and destroyed public property across Haryana to demand reservation in government jobs. The paramilitary forces had to be called in to control the mess that followed.
But the point is: Will this reservation in government jobs help the Jats? Or, to ask a more specific question, does reservation in government jobs really help these days? The data that I have shared until now clearly shows that reservations are of no help these days because the number of government jobs has either come down or increased at a very minuscule pace.
The question is: Why do people still believe in the idea of reservations? In the recent past, there has been a spate of protests across the country, carried out by people belonging to castes which are generally seen as well off. These include the Kapus in Andhra Pradesh, the Marathas in Maharashtra, the Patels in Gujarat, and the Gujars in Rajasthan.
A simple explanation for this lies in the fact that the salaries paid by the government at lower levels have gone up and are significantly higher than those paid by the private sector. Hence, those who manage to get into a government job on the basis of reservation do benefit. While the government is not creating jobs on the whole, it hasn’t stopped recruiting totally and is always recruiting to replace the people who are retiring.
It is worth asking here why the central government can’t play the role of Big Government and create jobs directly. In the case of the central government, the simple answer lies in the salaries and pensions that it needs to pay to current and former employees. In 2016-2017, the total salary and pension (excluding the Railways) bill is expected to come in at Rs 2,25,000 crore. This amounts to a little more than 21.3 per cent of the central government’s share of the tax revenues.
Furthermore, the amount that the central government is likely to spend on salaries and pensions in 2016-2017 is Rs 40,000 crore more than what it did in 2015-2016. Interestingly, the salary and pension bill in 2015-2016 amounted to 19.5 per cent of the central government’s share of the tax revenues.
The point being that the money spent on salaries and pensions already forms a significant portion of what the central government earns every year, and this when the number of central government employees hasn’t really gone up at a fast pace.
Given this, it is not surprising that the government is really not in a position to create jobs anymore.
Introducing ElectionsHQ + 50 Ground Reports Project
The 2024 elections might seem easy to guess, but there are some important questions that shouldn't be missed.
Do freebies still sway voters? Do people prioritise infrastructure when voting? How will Punjab vote?
The answers to these questions provide great insights into where we, as a country, are headed in the years to come.
Swarajya is starting a project with an aim to do 50 solid ground stories and a smart commentary service on WhatsApp, a one-of-a-kind. We'd love your support during this election season.
Click below to contribute.
Latest