Politics
Covid-19 Update: Why West Bengal's Data Leaves You More Puzzled Than Relieved
- In charts: Is epidemic situation in West Bengal under control?
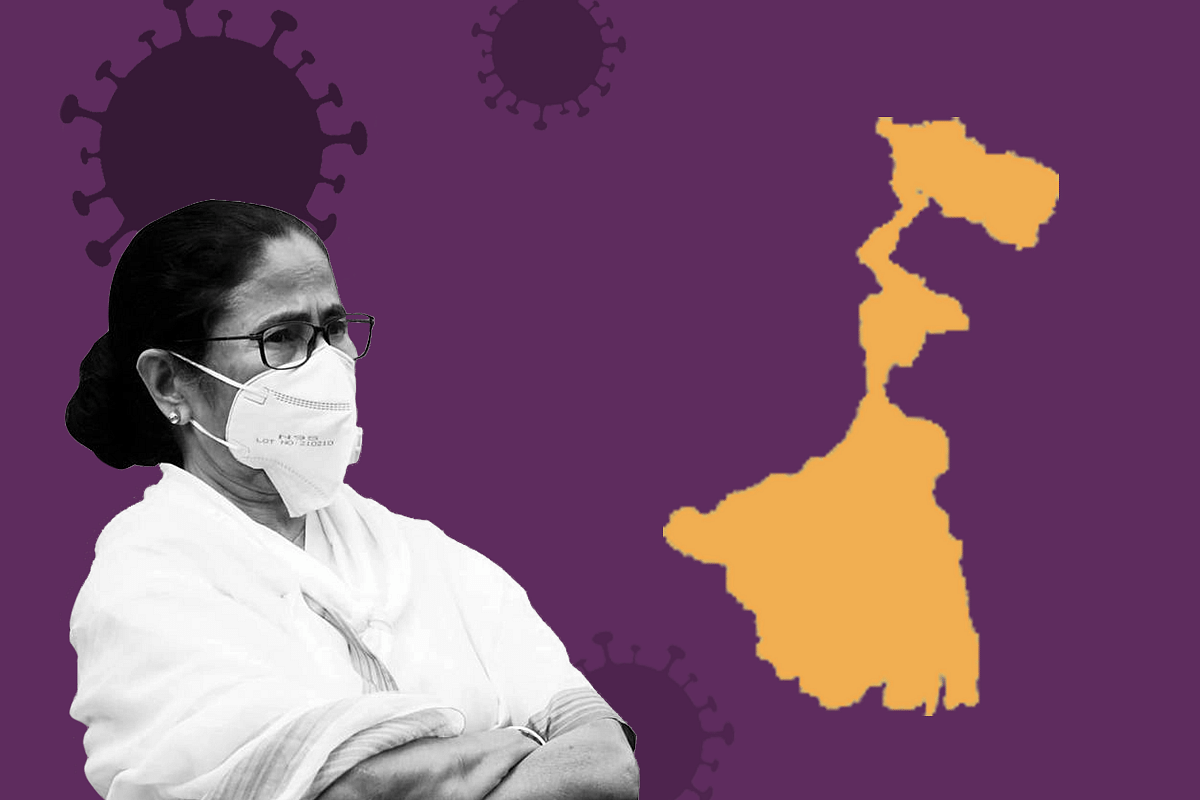
West Bengal CM Mamata Banerjee (Covid-19 situation in Bengal)
The past fortnight has seen the second wave of the Wuhan virus settle into a lopsided trend: while most states of the union are firmly in the clear, and economic activity there is slowly returning to a semblance of normalcy, a few remain wretchedly incapable of stamping out the Chinese contagion.
This asymmetry in containment means that a coordinated, whole-of-nation effort, which is how the virus should ideally have been fought, becomes a dead letter even before it is written.
Kerala, followed by Maharashtra, holds the gravest risk of triggering a pan-national third wave. The entire North East is marred by multiple clusters. In Karnataka, Tamil Nadu, Andhra Pradesh, and Odisha, eradicating the menace is still a work in progress.
And then there is West Bengal. This is the current situation in the state:
There are numerous issues. As we see from the chart above, testing levels (purple curve), which had never been very high to start with, have declined further to just about 50,000 samples a day. That is grossly inadequate for such a densely populated state, with multiple clusters continuing to fester in districts like North 24 Parganas, Darjeeling, Cooch Behar and Jhargram.
Consequently, the state’s daily case counts (red curve) have settled into a high plateau through July, as has the Test Positivity Ratio (TPR; green curve), and the cumulative positivity (orange curve) remains in double digits.
By what measure, then, may it be deemed that the epidemic situation in West Bengal is under control? One answer to this fundamental query is offered by the chart below:
On the face of it, this analytical plot of cumulative positivity versus tests per million shows that West Bengal crested its peak, and dramatically reversed trends, even before five per cent of the state’s population had been tested out. That is a magnificent achievement by any yardstick.
But, there are also serious contradictions. Such a curve is unique in the annals of containing the Wuhan virus: no other large state has managed to effect such a sharp reversal, in such a short span, to such an extent, after its cumulative positivity rose so high, with so little testing.
For comparison, look at how some of the other large states combated the contagion. Whether it is those who contained transmissions efficiently, like Uttar Pradesh, Gujarat and Bihar, or those who had to go through a long grind, like Andhra Pradesh and Tamil Nadu, all had to test out a minimum of five to ten per cent of their populace before they could bring matters under control.
In addition, readers may note that Gujarat, Tamil Nadu and West Bengal all took off from the same point (see Y-axis in Chart 2), but for some inexplicable reason, West Bengal alone, with a much larger and denser population, somehow managed to bend the curve abruptly and sharply, with a just third of the testing others required.
The uniqueness of the West Bengal curve becomes even more apparent in Chart 3 below, if we add on some more states like Maharashtra and Kerala, where epidemic management is still in a mess:
Importantly, we see that the West Bengal data (red curve) behaves as a stark outlier, whether compared to states which tackled the epidemic efficiently or to those that didn’t. Such an abrupt rise and decline are unnatural and an administrative impossibility, since eighteen months of evidence shows that epidemics do not behave like this – not in their transmission, nor in their containment.
After all, a state is deemed to be in the clear, only once its daily case counts come down to double digits, its TPR holds steady under one per cent, and its cumulative positivity is reduced to below five per cent. For that, the only tool is high testing levels. Bihar is still testing well over a lakh samples a day, long after its TPR fell to near zero; Karnataka is at the same level of testing, and its cumulative positivity has just entered into single digits.
Furthermore, if West Bengal is indeed in the clear, then why are daily cases and TPR plateauing, and why is the cumulative positivity still so high after so long? If the sharp reversal seen on the West Bengal curve is truly reflective of the actual ground situation, then how come the cumulative positivity hasn’t declined faster to lower levels? How is it that West Bengal bent the curve before it had tested 5 per cent of its population, but yet is still up there on the cumulative positivity scale alongside Maharashtra and Kerala, where the epidemic continues to rage?
Obviously, and without casting aspersions on government data, for the time being, the inference is that this is a chimera generated by insufficient testing. Meaning, that the epidemic is still very much on in West Bengal and that a true stamping out will happen there only when monitoring is raised, consistently, to at least a lakh samples a day for starters.
And regarding the extremely peculiar pattern of West Bengal’s epidemic management curve seen in Chart 2, answers may be sought only after the state government releases detailed district-wise testing data from February 2021 onwards, when the second wave began. Matters will remain under a cloud till then.
The question is: will the state government do the needful, or instead, mistakenly assume that the situation there is improving, and continue to make public health policy choices based on an illusion formed by inadequate monitoring?
All data from Covid19india.org
Support Swarajya's 50 Ground Reports Project & Sponsor A Story
Every general election Swarajya does a 50 ground reports project.
Aimed only at serious readers and those who appreciate the nuances of political undercurrents, the project provides a sense of India's electoral landscape. As you know, these reports are produced after considerable investment of travel, time and effort on the ground.
This time too we've kicked off the project in style and have covered over 30 constituencies already. If you're someone who appreciates such work and have enjoyed our coverage please consider sponsoring a ground report for just Rs 2999 to Rs 19,999 - it goes a long way in helping us produce more quality reportage.
You can also back this project by becoming a subscriber for as little as Rs 999 - so do click on this links and choose a plan that suits you and back us.
Click below to contribute.
Latest