Politics
Population Control: Kerala Numbers Show Why Official Definition Of TFR Will Not Work In India
- The official definition of Total Fertility Rate (TFR) fails to capture the actual fertility levels in Indian society, resulting in high underestimation of TFR.
- In general TFR rates have been highly underestimated and in particular there have been some concerted efforts to hide the high fertility rates among Muslims.
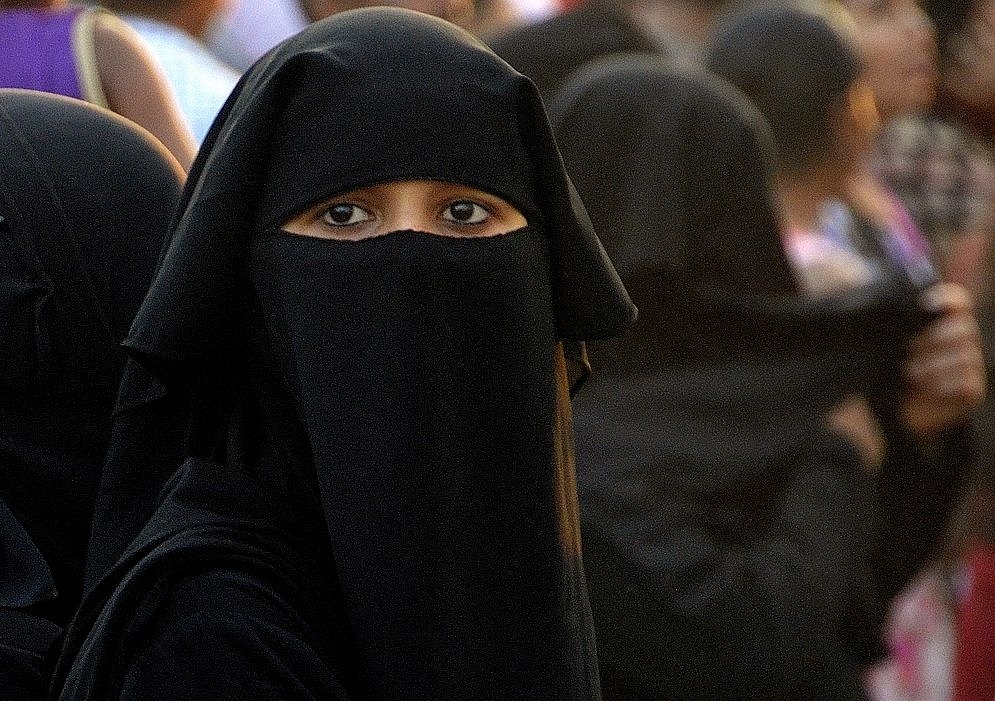
Total Fertility Rate and Muslim women.
The Prime Minister’s suggestion to check population in his address to the nation on 15 August 2019 has invited massive criticism, mainly on four counts.
First, India doesn’t require any check on its population since it has already reached a total fertility rate (TFR) of 2.2, which is very close to replacement TFR of 2.1.
Second, if any forced policy was adopted to check population, it will later result in a China-like situation, where the government had to revert their one-child population policy due to their ongoing problem of an aging population.
Third, once TFR starts falling, it will be difficult to reverse, as can be noticed in most developed Western and North American countries. Therefore, rather than putting a check on population, India should think of tackling the forthcoming problem of an aging population.
Fourth, this is to target Muslims only (under pressure from RSS), while ignoring the fact that the little higher TFR of Muslims is due to high poverty and less literacy/education levels among them.
The fact, however, that stares in our face is that the official definition of TFR is bound to fail in capturing the actual fertility levels in Indian society, resulting in high underestimation of TFR.
Moreover, one notices that TFR calculations vary significantly with different data sources.
TFR And Its Sources
According to the World Health Organization (WHO), TFR, in simple terms, refers to the total number of children born or likely to be born to a woman in her lifetime, if she were subject to the prevailing rate of age-specific fertility in the population.
A TFR of about 2.1 children per woman is called replacement-level fertility. If replacement-level fertility is sustained over a sufficiently long period, each generation will exactly replace itself. In other words, the population will remain constant.
There are three major data sources from which TFR can be calculated, namely, the periodic census reports based on all households held at intervals of 10 years, the Sample Registration System (SRS) and National Family Health Survey (NFHS) based on samples generally in the middle of census periods, and the Annual Vital Statistics Reports published by all states every year.
Problems With TFR Calculation
TFR is the expected number of births given by a woman in her entire life but its calculation includes women aged between 15 to 49 years only. If any woman aged less than 15 years or more than 49 years gives birth to a child, it is not counted for the calculation of TFR.
The Census-2011 for the state of Kerala shows that a large number of children were born to women aged less than 15 years and greater than 49 years, especially among Muslims. However, the TFR figures based on the same Census-2011 for the state of Kerala are 1.53 for Hindus, 1.7 for Christians and 2.3 for Muslims.
If the two age groups (less than 15 and greater than 49) are also included in the TFR calculation, it will drastically increase the Muslim TFR over other religious groups.
Similarly, one also notices a higher degree of underestimation of TFR in less literate and poor states, where incidences of marriage before attaining the age of 15 are likely to be very high, especially among the Muslims, due to no minimum age bar for marriage.
Additionally, TFR calculations are based on past and current trends, and it captures only natural progression in age-specific fertility. It fails to provide unbiased estimates in the eventuality of external influences on age fertility, like for example influence of religious leaders, government, etc.
For instance, the Syro-Malabar Archbishop requested Christians to increase their population in 2006 (similar announcements have been made by religious leaders of almost all religions), While this may increase the planned fertility for a woman, her current TFR will remain same.
Contradicting Data
The NFHS-4 data on TFR for the whole of India for the year 2015-16 indicates that ‘general Hindu’ TFR is 2.13 while the Hindu Scheduled Caste’s (SC) TFR is 2.26. This minuscule difference may be attributed to the fact that SCs are mostly located in rural areas.
Similarly, the SRS baseline survey 2014 shows that the average family size of ‘general Hindus’ is 4.3 while the same for Scheduled Castes is 4.4. This data also corroborates the minuscule difference in TFR among these two groups.
Since there isn’t any TFR differential between the Hindu SCs and other Hindus, the question arises: can we conclude that there aren’t any income/poverty and literacy/education differential between these two groups? But a lot of National Sample Survey (NSS) and Census reports point to education and income differential between these two groups.
Therefore, either one of the following must be true: no income/poverty/literacy differential exists between these two social groups or there is another very important factor that affects population growth.
Interestingly, this low income/literacy criterion is always propagated to explain high TFR of Muslims, while at the same time it is also claimed that the socio-economic conditions of Muslims is comparable to the Hindu Scheduled Castes.
Inconsistency
In order to throw light on the contradiction in the NFHS-4 data, let us take the case of the state of Kerala, which has the highest literacy, comparatively less poverty, and one of the best public health system --- almost all pregnant women are attended to by trained health professionals and almost all births are registered.
The NFHS-4 data for 2015-16 for Kerala shows that TFR for Hindus and Muslims were reduced to 1.42 and 1.86 respectively, which means that the Muslim TFR is only 35 per cent higher than that of Hindus.
Now how does one resolve what this data shows while all other factors related to demography during the same period completely contradict these figures?
For instance, the number of births by Muslim women and Hindu women for the year 2016 were 21,1182 and 20,7831 respectively, which indicates that despite their population being almost half of the Hindu women, Muslim women gave birth to more children.
In other words, on an average, there were 100 per cent more births from Muslim women than their Hindu counterpart.
Similarly, if we look at the voter list, we find that the percentage increase in the number of voters between 2014 and 2019 is more than 100 per cent higher in the Muslim-dominated parliamentary constituency (Malappuram) than the parliamentary constituency with least Muslims (Thiruvananthapuram).
How is it possible that when all other factors related to population are indicating around 100 per cent difference between Muslims and Hindus, the TFR is showing just a 35 per cent difference?
If we calculate the TFR for Kerala on the basis of the Annual Vital Statistics Report-2016, it comes to around 2.8 for Muslims, while the same for Hindus is 1.3, which actually shows that the Muslim TFR is more than a 100 per cent higher than that of Hindus in the state.
Moreover, in the first class of TFR age interval (15-19), Muslim women had more births than the combined births by women of all other religions in the state. Even the share of Muslim women in the higher order of birth (3rd child, 4th child, and so on) is extremely high compared to the combined share for all other religions (See Table 1).
It doesn’t make any sense as to why the government has resorted to NFHS-4 survey to calculate TFR, which is based on just 11,555 households for the state of Kerala when the TFR can easily be calculated on the basis of Annual Vital Statistics Reports published every year. Doesn’t this raise doubts on NFHS-4?
All these figures indicate that in general TFR rates have been highly underestimated and in particular there have been some concerted efforts to hide the high fertility rates among Muslims.
The criticism that even China had to revert its one-child policy is very bizarre since no demographic policy can be adopted forever. In fact, it keeps on changing on the basis of circumstances and requirement.
It is also very strange to see that mainstream intelligentsia no longer considers population a problem in a country that shall become the most populous country in the world in the near future.
They are purposively associating major problems faced by India, which are, lack of self-sufficiency in agricultural production, shrinking area under agriculture and forests, rapid urbanization, lack of space for outdoor sports, decreasing availability of potable water, environmental degradation, increasing pollution, etc., solely to ‘poor management’.
Given the fact that the world is rapidly adopting artificial intelligence (AI), overseas jobs for Indians are going to shrink very fast, and it is high time for India to take a call on its population.
Introducing ElectionsHQ + 50 Ground Reports Project
The 2024 elections might seem easy to guess, but there are some important questions that shouldn't be missed.
Do freebies still sway voters? Do people prioritise infrastructure when voting? How will Punjab vote?
The answers to these questions provide great insights into where we, as a country, are headed in the years to come.
Swarajya is starting a project with an aim to do 50 solid ground stories and a smart commentary service on WhatsApp, a one-of-a-kind. We'd love your support during this election season.
Click below to contribute.
Latest