Science
Interview: IIT-K Professor Manindra Agrawal On The SUTRA Model
- Professor Manindra Agrawal of IIT-K explains his SUTRA model that charts the spread of Covid-19 in each state.
Manindra Agrawal
Manindra Agrawal is a Professor of Computer Science at the Indian Institute of Technology, Kanpur which is also his alma mater where he did his graduation in 1986 and PhD in 1991. Winner of Gödel Prize (which recognises outstanding contribution in Theoretical Computer Science) and Fulkerson Prize (both in 2006), Prof. Agarwal is also a recipient of India’s fourth-highest civilian award Padma Shri.
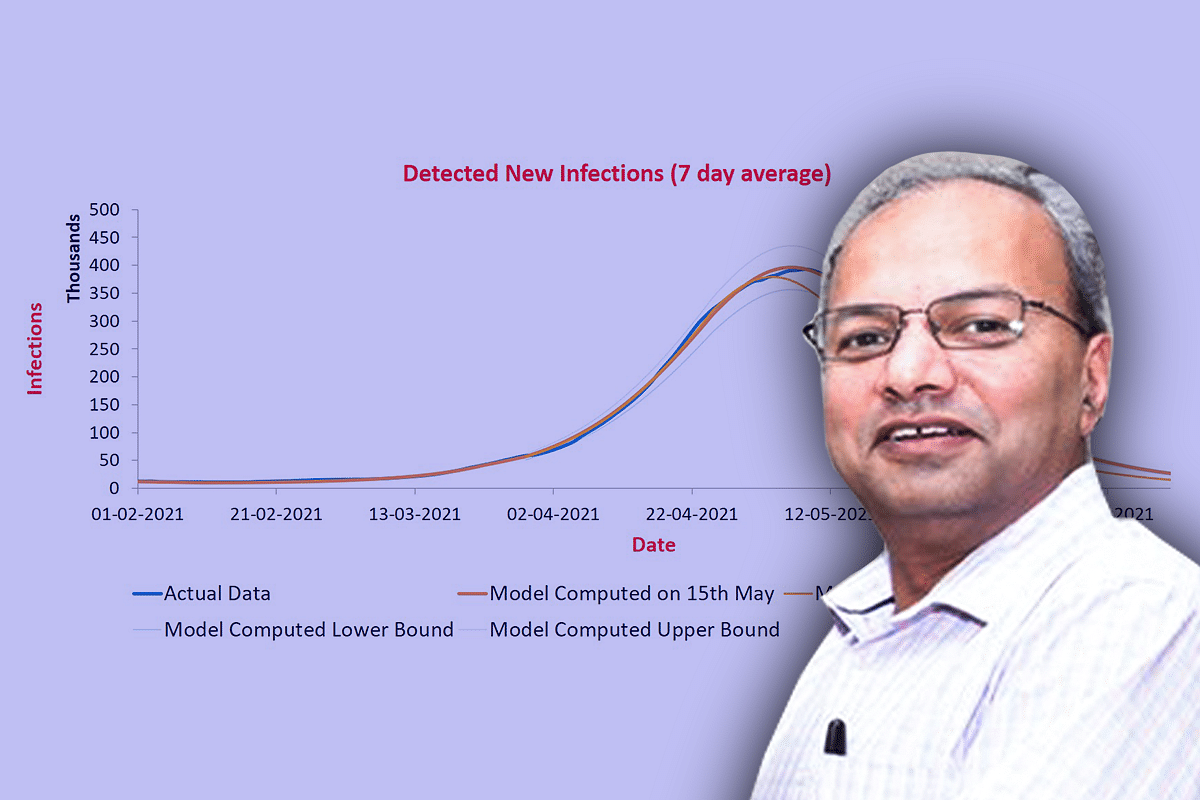
He along with Madhuri Kanitkar, Deputy Chief, Integrated Defense Staff and M Vidyasagar, Professor, IIT Hyderabad developed the SUTRA model (the Susceptible, Undetected, Tested (positive), and Removed Approach) for charting the trajectory of Covid-19 in India. The SUTRA model came under a lot of criticism for its inability to predict the true magnitude of the second wave in early April. However, it was able to predict the peaks of infections and active infections after mid-April due to which it has received a lot of accolades.
We talked to Prof Agrawal to understand the model for layperson, enquire about the criticisms levelled against it and what can be done to improve upon the model to enable it to better predict the trajectory of the pandemic going forward.
Below are excerpts from the interview:
Q1. Can you explain the SUTRA model for dummies and how different is this model from the ones developed to understand the behaviour of the past pandemics?
Nearly all the models divide population of the region under study into compartments, which are refinements of Susceptible (those not infected yet), Removed (those infected in the past but no longer), and Infected (those currently infected). They set up equations capturing how much population transfers from one compartment to another in one day and then compute the trajectory over time.
In order to do the computation, the models need to estimate values of certain parameters influencing the equations. These parameters depend on infectivity of virus, density of population, status of preventive measures etc. Epidemiologists estimate values of these parameters based on their study of virus and region of interest.In principle, one can compute values of the parameters if one knows the sizes of compartments over time, however, that is mostly not available.
For example, in Covid, the size of Infected compartment is not available as reported cases are a small subset of actual cases. Therefore, epidemiologists use alternative methods for estimation.
SUTRA is the first model that computes values of parameters from reported data. The reason it can do so is that reported data satisfies a rather unexpected property which shows that reported and actual data differ by a scaling factor and this factor remains stable for extended period of time. Exploiting this property, the model is able to estimate the values of all parameters of the model and then compute the trajectory of the pandemic.
The parameter values used in any model change with time. For example, a parameter called contact rate determines how fast is the pandemic spreading. It value reduces due to lockdowns and increases if there is faster spreading mutant. When such a change happens, it causes a "phase change" in our model. That is, the model detects that parameter values are changing. This leads to a new phase, and initial period of the new phase is called "drift period" because in this period parameter values change continuously.
After some time the values stabilise, which is called "stable period" of new phase. It is generally observed that stable periods are much longer than drift periods (for India, about 2/3rd of days have been in stable period).
When a new phase is in drift period, since model does not know the final value of parameters, its predictions can be off. That is what happened in April beginning. A new phase for India started on 29 March and drift period was longish: 26 days. The reason for longish period was that the virus was fast spreading over communities leading to continuous expansion of its reach. On 24 April, the parameter values stabilised. And predictions made from 25 April onward were quite accurate.
This is a drawback of our model: when in drift period, it cannot predict future well. It does get somethings right, like we got the timing of the peak almost right even in early April, but peak value was missed by a large margin. It is, however, a drawback of every model: it is hard to predict what will future be when things are changing very fast on the ground.
Q3. Based on the SUTRA model, you had presented the projections to the government in early April. Based on that, the peak was supposed to be at less than 1.5 lakh daily infections. On 26 March, the model was estimating 70-80k infections at maximum. This is the biggest concern with the SUTRA model - that it detects a phase change only ex-post. So, while the model does a very good job of fitting the data, what matters for a policy maker is a reliable forecast somewhat far out in the future. Would you say that the SUTRA model is somewhat deficient in this regard?
SUTRA can forecast future well as long as phase does not change. And as I mentioned above, when phase starts changing, it can be detected since a certain equation breaks down. What it cannot do is predict when a phase change will occur and what will be resulting values of parameters. It can be used to do what-if analysis by guessing various parameter values for future though.
Q4. Is there some information or data that you wish you had that can make the model better to predict the future waves more accurately in the beginning so that governments can act accordingly in advance?
We have been requesting for an up-to-date serosurvey in the country to help estimate the percentage of immune population. If we had that number for March, we could have done a worst-case analysis in March-end of how bad can the second wave be. Going forward, this will remain a crucial piece of information.
Q5. On phase change, there are mainly two reasons why a phase could change. One is that the virus changes substantially. The second is that people change their behaviour or a lockdown happens. Biologists can know a great deal about the former and economists know something about the latter. There’s a charge that neither were consulted by Dr Agarwal in preparing the model. What would be your defence to this charge?
There is another reason why a phase change can occur. We have a parameter called reach of pandemic, which measures the percentage of population over which the virus is currently active. Virus mutation or people's behaviour impact contact rate parameter. Now this parameter has a narrow range of values. It was 0.33 before lockdown in March last year, came down to 0.15 during lockdown, and went up to 0.22 in November. It then went up to 0.39 in March (due to mutant and people's behaviour) and came down a bit to 0.33 in April (due to protection measures taken).
It was easy for us to do simulations with contact rate set to 0.33 as it was pre-lockdown in March. As it transpired, that would have been perfect guess too, without needing biologists and/or economists.
So guessing value of contact rate was not a problem. The problem was guessing what is the current value of reach. This can only be done through a recent serosurvey, which was not available. If we knew a good approximation of reach, we could have set it to 100 per cent, and contact rate to 0.33, and simulated what comes out. It would have been quite close to what actually happened. We now know that reach could not have been more than 50 per cent in March. We were working under the (incorrect) assumption that reach is close to 80 per cent at the time.
A lot of people criticising have either not read our paper or not understood the reach parameter.
Q6. What was the reason that the phase started stabilising after 20 April? How big a part did lockdowns play?
We have simulated 25+ countries, 35 states and UTs, and 300+ districts and in each of them, approximately 2/3rd of days are in stable period and remaining in drift period. This suggests that stability is a natural phenomenon and phases stabilise in short time. In this specific case, reach stopped growing rapidly by April-end. This could either be due to it coming close to 100 per cent or due to lockdowns or some other factor.
Q7. Some people continue to insist that lockdowns don't work. But as per your model, they clearly have an impact. What frustrates people more is that there seems to be no good rationale behind the decision to go under lockdown. For instance, States started closing down too late and are now taking too much time to open up when daily case curve has crashed. Can the model recommend wiser lockdown periods to States - when to close and when to open up (for example if there is too much volatility in parameters - maybe close down immediately?, etc)
Models can recommend good lockdown strategies. We have analysed lockdowns in four states and found that while it worked well for UP and Delhi, it was not so useful for Karnataka and Telangana. We can also suggest when to open lockdowns, however, that needs a good estimate of what the reach parameter value is.
Introducing ElectionsHQ + 50 Ground Reports Project
The 2024 elections might seem easy to guess, but there are some important questions that shouldn't be missed.
Do freebies still sway voters? Do people prioritise infrastructure when voting? How will Punjab vote?
The answers to these questions provide great insights into where we, as a country, are headed in the years to come.
Swarajya is starting a project with an aim to do 50 solid ground stories and a smart commentary service on WhatsApp, a one-of-a-kind. We'd love your support during this election season.
Click below to contribute.
Latest