Science
National Science Day: The Raman Effect And One Of Its Key Applications, Explained
- As India celebrates National Science Day, here's an insight into the Raman effect and its applications — a classic example of the synergy between science and technology.
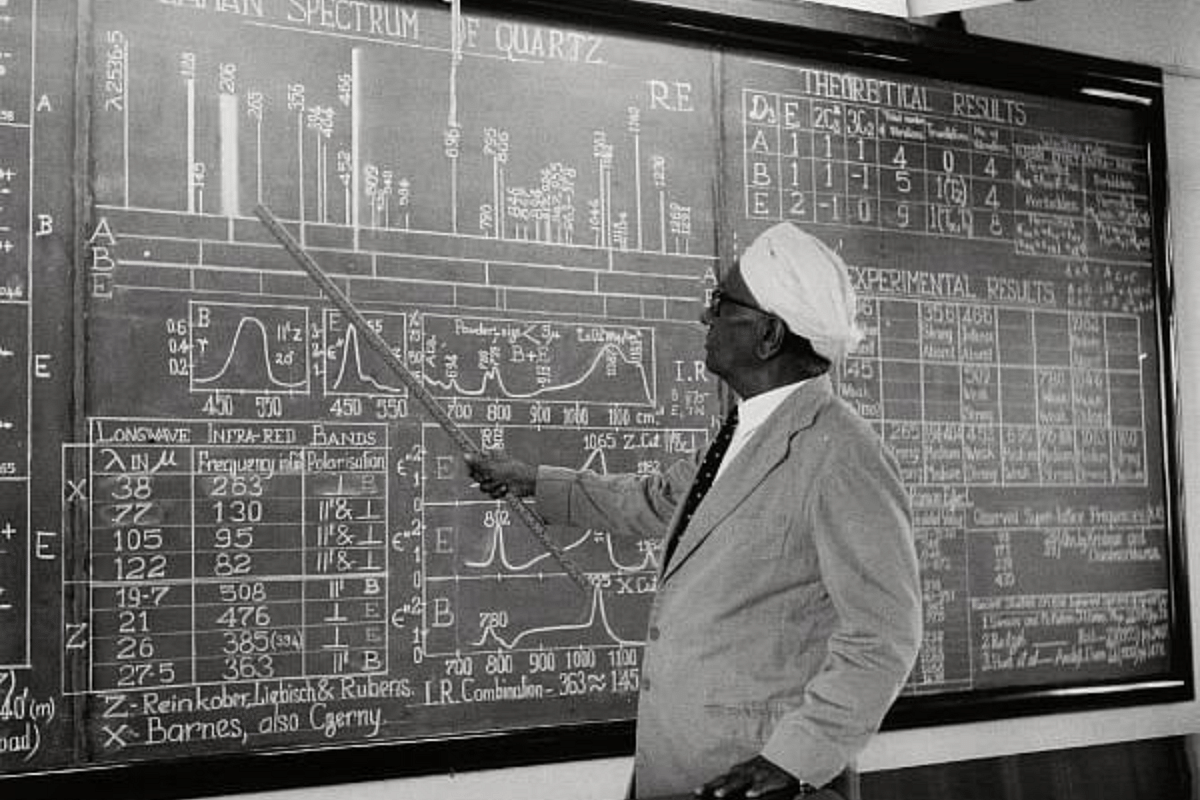
Sir C V Raman pointing to information on a large blackboard as he gives a lecture, 5 August 1958. (Keystone Features/Hulton Archive/Getty Images)
India celebrates National Science Day every year on 28 February to commemorate the discovery of the Raman effect by Sir Chandrasekhara Venkata Raman on this very day in 1928.
Raman was the first Indian Nobel prize winner (1930) in the field of science and what’s unique about him is that he got the prize for work done in India, at the Indian Association for the Cultivation of Science (IACS), Calcutta (Kolkata).
The theme for this year's National Science Day is “integrated approach in science and technology for a sustainable future". In this context, the Raman effect is a very good example as to how discoveries in the sciences (physics) can be used for a variety of technological applications, such as in the materials sciences, chemical and biochemical areas, pharmaceutical industry, and medicine.
Raman Effect
Raman’s interest in the scattering of light by molecules that ultimately led to the discovery of the Raman effect was triggered during his return journey to India by sea in 1921, after his first foreign trip to England as a Palit Professor at Calcutta University.
Prior to this, his major contributions had been in the field of acoustics and study of musical instruments.
While on board the ship, Raman noticed the dark blue colour of the sea, but was not satisfied by the explanation by Lord Rayleigh that it was due to the reflection of the blue colour of the sky.
Lord Rayleigh had explained the blue colour of the sky as due to scattering of light by molecules in air. These molecules, being much smaller in size compared to the wavelength of light, scatter light by different amounts depending on the wavelength.
The scattered intensity of light is directly proportional to the fourth power of the frequency. Consequently, blue light is scattered more than red. Hence the blue colour of the sky. This kind of scattering is called Rayleigh scattering and is an example of elastic scattering, where the frequency of the scattered light does not change.
Raman conducted many experiments to study the light scattered by sea water using instruments he had with him during his journey and published a couple of papers in the prestigious journal Nature by the time he reached India. He later published a book titled Molecular Diffraction of Light in 1922, reviewing the various aspects of scattering of light by gases, vapours, liquids, crystals, and amorphous solids, as was known until then.
He continued with his experiments on the scattering of light with his students in Calcutta, which eventually led to the discovery of the effect, later named after him.
The Raman effect is an example of inelastic scattering, where the scattered light can have a higher or lower frequency, unlike Rayleigh scattering.
The effect seen by Raman could be explained using the then newly proposed idea of light quanta. This was first used by Albert Einstein to explain the phenomenon of photoelectric effect. Later, this same idea was used by Arthur Compton to understand the Compton effect in 1923.
Compton effect is an inelastic scattering of X-rays by electrons, where the incident X-rays' wavelength increases after its interaction with the electrons. Raman applied these new quantum ideas boldly to understand the newly discovered effect. This idea of inelastic scattering was predicted theoretically by Adolf Smekal in 1923, but wasn’t observed till 1928.
Raman and his colleagues had observed inelastic scattering in a variety of liquids. Around the same time, G S Landsberg and L I Mandelstam had also observed a similar effect in inorganic crystals (“the Raman effect” is still called “combination scattering” in Russia).
We can understand the emission of light of smaller frequency (called Stokes Line) and larger frequency (called anti-Stokes line) in the Raman effect by looking at an energy transition from a lower energy state to a higher virtual energy state, as shown in Figure 1.
Virtual states are intermediate energy levels where the electrons from a lower state of an atom or molecule could be excited for a very short time. These virtual states should be below the electronic excited state so that the molecule does not absorb the incident photons completely.
The electronic ground state, from where the electrons are excited by absorption of light, are further divided into sub-levels called the vibrational energy states. These vibrational levels occur in all molecules due to the quantisation of the vibrational energy of the molecule.
When a ground state electron in a particular vibrational level absorbs the incident photon, it gets excited to the short-lived virtual state. When the electron returns back to the ground state, it can result in three possibilities.
First, it comes back to exactly the same level as the original ground state, resulting in what we call Rayleigh scattering (elastic scattering), emitting light of the same frequency υ0.
It can also come back to a higher vibrational ground level, emitting a lower frequency photon (υ0 – υ1). This is called the Stokes line.
And, finally, it can come back to a lower ground state vibrational level, emitting light of higher frequency (υ0 + υ1), called Anti-Stokes line.
The experimental scheme to measure the different frequencies (initially only the Stokes line was identified) due to inelastic Raman scattering effect is shown in Figure 2.
The violet light from sunlight was first separated. It then falls on the liquid sample. The scattered radiation from the sample contains both the original violet component (Rayleigh scattered light) and the lower frequency green light (Raman Stokes Line).
The anti-Stokes line is difficult to observe due to its weak intensity. The Raman component is separated from the predominant violet light using a green filter and seen by the observer.
Initially, Raman and his student K S Krishnan thought that the weaker lower frequency component is fluorescence shown by the liquid. However, they later showed that the scattered light was polarised, which is not expected for fluorescence. They published the results in the journal Nature in a report titled “A New Type of Secondary Radiation".
Later, refined experiments using a spectroscope carefully identified the wavelength of both the incident and scattered radiation very accurately for the various liquids. The significance of the Raman effect is that each molecule, depending on its structure, has a unique characteristic signature spectrum like a fingerprint. This makes it a very useful tool to study the structure of materials and has been widely applied to diverse fields, like chemistry, materials science, biology, and the pharmaceutical industry.
Applications: Raman Spectroscopy
Raman had emphasised during his Nobel prize address in 1930 that “... the character of the scattered radiations enables us to obtain an insight into the ultimate structure of the scattering material."
In the beginning, after the discovery, most of the publications on the Raman effect were by physicists. Later, by mid 1930s, it became an important tool for non-destructive analysis of chemical substance in the hands of chemists, as predicted by Raman.
The true potential of the Raman effect for applications had to wait till the invention of lasers in the 1960s to pick up again. The main reason was that the Raman effect is inherently weak and required a strong intensity of the incident light to observe both the Stokes and anti-Stokes lines (even more weaker).
Also, newer techniques, such as the Fourier transform (FT)–Raman spectroscopy and surface-enhanced Raman spectroscopy (SERS), have revolutionised the use of Raman spectroscopy for a wide range of applications. These spectrometres are now commercially available, making these applications more viable for use in industries directly.
Raman spectroscopy offers an advantage to study biological and inorganic samples due to its ability to be studied in aqueous solutions, besides in gases and solids. Also, the amount of sample needed for the study is small and can be used non-destructively.
Further, it has been used to study manufacturing processes in petrochemical and pharmaceutical industries. Raman spectroscopy is used to find compound distribution in tablets, active pharmaceutical ingredient (API) concentration, purity, polymorphic forms, to study blend uniformity, and so on in the pharma industry.
It has also found applications in geology and mineralogy to identify minerals, phase distribution, mineral behaviour at extreme conditions, and so on.
Nanotechnology and the semiconductor industry also find application related to characterisation and structural analysis using Raman spectroscopy. It has also found applications in biology and medicine as an important diagnostic tool, such as to study the structure of proteins and detection of biomolecules in cells and tissues.
Raman microscopy and imaging can also be used to spatially map the Raman signal within cells to identify malignant tissue in various parts of the human body, both in vivo and in vitro conditions.
The Raman effect and its applications is a classic example of the synergy between science and technology.
The initial discovery of the Raman effect was useful to understand the quantum nature of the molecules showing the effect. Later, it opened doors to applications in chemistry, helping to understand the structure of molecules.
Owing to the weakness of the effect after some time, other techniques, such as infrared spectroscopy, became a more popular tool for chemical analysis. But with the invention of lasers and other techniques, such as SERS and FT-Raman, the effectiveness of Raman spectroscopy in various fields was rediscovered and have been enhanced till date.
This article has been published as part of Swasti 22, the Swarajya Science and Technology Initiative 2022.
Introducing ElectionsHQ + 50 Ground Reports Project
The 2024 elections might seem easy to guess, but there are some important questions that shouldn't be missed.
Do freebies still sway voters? Do people prioritise infrastructure when voting? How will Punjab vote?
The answers to these questions provide great insights into where we, as a country, are headed in the years to come.
Swarajya is starting a project with an aim to do 50 solid ground stories and a smart commentary service on WhatsApp, a one-of-a-kind. We'd love your support during this election season.
Click below to contribute.
Latest