Economy
RBI's Inflation Expectations Survey Impacts Your EMI — And It's Almost Certainly Off The Mark
Diksha Yadav
Feb 24, 2025, 03:34 PM | Updated Apr 02, 2025, 02:48 PM IST
Save & read from anywhere!
Bookmark stories for easy access on any device or the Swarajya app.

The Reserve Bank of India (RBI) was keeping interest rates high because its study showed that inflation expectations in the economy were high. But were they really? Could it be that the RBI’s methodology to measure inflation expectations was giving it an inaccurate picture?
If yes, has the Indian economy suffered high rates of interest owing to incorrect measures of the RBI based on inaccurate studies?
What People ‘Expect Of Inflation’
Inflation expectation is essentially what people (consumers, businesses, financial markets, and policymakers) think the rate of inflation will be in the future. It is a forward-looking concept that influences economic decisions such as spending, saving, borrowing, and investing.
It's like a forecast that influences how we make financial decisions today, based on what we expect prices to be tomorrow.
The actual Consumer Price Index (CPI) inflation data and the inflation expectations data of the RBI shows there’s a gap of at least 3-5 per cent and sometimes even more between the expected inflation and actual inflation over the past few months.
For example, year-on-year inflation rate based on the All India Consumer Price Index (CPI) for the month of January 2025 over January 2024 is 4.31 per cent (provisional). There is a decline of 91 basis points in headline inflation of January 2025 in comparison to December 2024, according to central government data.
Similarly, year-on-year inflation rate based on All India Consumer Food Price Index (CFPI) for the month of January 2025 is 6.02 per cent (provisional) and year-on-year housing inflation rate for the month of January 2025 is 2.76 per cent. Corresponding inflation rate for the month of December 2024 was 2.71 per cent.
But, when it comes to Central Bank’s Household Inflation Expectations Survey (HIES), the three months ahead inflation expectations (i.e survey of October 2024 – people anticipating inflation for three months ahead) and one-year ahead inflation expectations (i.e survey of January 2024 – peoples’ inflation perception for 12 months ahead) report showed inflation expectations to be 9.1 per cent and 10 per cent respectively.
Moreover, in its latest Monetary Policy Committee (MPC) meeting (7 February 2025), the RBI projected CPI inflation for the next financial year starting April to be at 4.2 per cent, while maintaining the forecast for 2024-25 at 4.8 per cent.
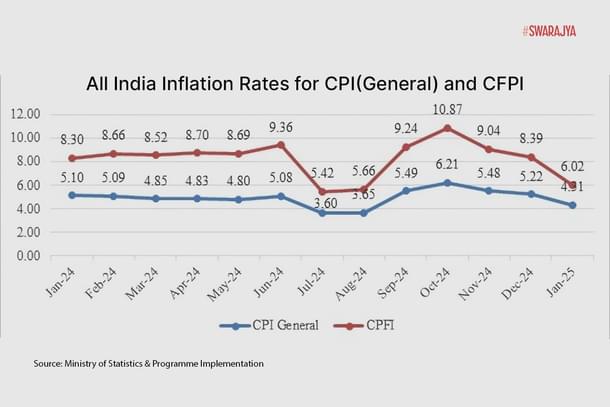
Look at graph 1 below: The Y-axis shows the inflation rates in percentage for the given month and the X-axis represents the months from January 2024 to January 2025. The CPI inflation is shown by the blue line, while the CFPI inflation rate is shown by the red line.
We see that the actual inflation has been in the range of 3-6 per cent last year, dropping to 3.60 per cent in July 2024 and rising to 6.21 in October 2024.
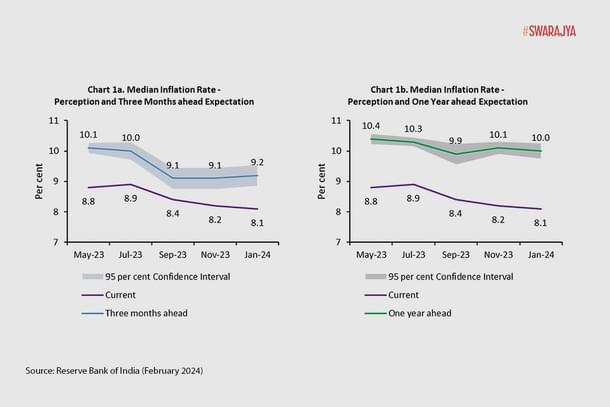
Now look at the inflation expectations data (Graph 2) as measured by the RBI in Household Inflation Expectations Survey for 2024.
The graph shows three months ahead (left - Chart 1a - in blue line) and one year ahead inflation expectation (right - Chart 1b - in green line). The X-axis shows the months from May 2023 to January 2024 and the Y-axis represents the inflation rate in percentage.
The HIES shows that inflation expectations were in the range of 9-10 per cent for 2024 (measured in 2023) in both three months ahead and one year ahead data. As clear from Chart 1b - the inflation expectation for July 2024 shown in green line (measured in July 2023), was 10.3 per cent while the actual inflation dropped to 3.60 per cent (graph 1). A similar trend can be noticed for the following months as well in the above graph.
We see that the numbers in RBI's expectations survey for inflation three-months ahead and a year-ahead have been consistently higher (almost double) than the RBI’s own projections of retail inflation and the actual inflation (for the same time).
Why It Matters, How It Impacts Us
The RBI seems to link the interest rate with the inflation expectations, says Dr Prasanna Tantri, Associate Professor of Finance at the Indian School of Business.
What the RBI has been saying, he explains, is that if:
–food prices stay high for a long time, people could start expecting higher inflation overall as well.
–This can lead to workers asking for higher wages.
–Which in turn can cause businesses to raise their prices, creating a cycle of rising costs.
The RBI’s report published last year (19 August 2024) titled ‘Are Food Prices Spilling Over?’ showed that when food prices go up, people's inflation expectations also increase.
“The dynamic multiplier (which helps to understand the effect of changes in a shock variable on its response, over a period of time) suggests that an isolated food inflation shock impacts inflation expectation up to 2 quarters, says the report.
“The historical decomposition (HD) of inflation expectations (deviation from the average) derived from the regression equation suggests that the persistent and one-sided food inflation shocks that have been experienced in recent times are positively contributing to inflation expectations, but their impact has been largely offset by the restrictive monetary policy stance and supporting rate actions.” (emphasis added)
In plain words, the RBI is patting itself on the back for its perceived achievement of keeping inflation in check in the face of heightened inflation expectations.
Back to the RBI report: “The counterfactual is that the impact of food inflation shocks on expectations outcomes would have been substantially higher in the absence of disinflationary monetary policy,” the RBI study adds.
Again, in plain words: Had we, the RBI, decreased interest rates, it would have led to higher inflationary expectations, and hence, higher inflation.
To manage the ‘spillover’ of high food prices to inflation expectations, says Prof Tantri, the RBI keeps interest rates high despite low core inflation (i.e except food and energy).
He says: "The idea is that higher interest rates will help control demand and keep employment levels lower. When fewer people have jobs, they are less likely to ask for higher wages, and businesses are less likely to increase their prices because of lower demand.
"By doing this, the RBI aims to prevent food price increases from leading to a broader rise in inflation expectations. This approach helps keep the economy stable and avoids a situation where prices spiral out of control," he adds.
But his main complaint, says Prof Tantri, is that the RBI is not measuring inflation expectations correctly.
Suppose actual inflation expectations is around 5 per cent, and the RBI thinks it is 10 per cent, then the central bank will keep interest rates higher than they should be, which will hurt investment and growth. "So the inflation targeting framework should first figure out the inflation expectation correctly".
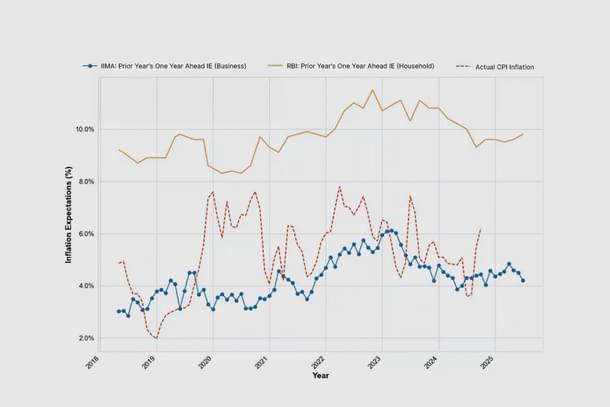
Look at the graph below. The orange line shows the mean inflation expectations from the RBI survey, while the red line indicates the actual inflation for the corresponding period. (The CPI inflation for January 2025 is 4.31 per cent.) It is evident from the graph that there is little correlation between the two.
Interestingly, inflation expectations measured by the Misra Centre at IIM Ahmedabad, which surveys business panelists (represented by the blue line), appear to align more closely with actual inflation than those from the RBI's surveys.
Does The RBI Need To Update Its Methodology To Calculate Inflation Expectations?
Let’s take the latest RBI inflation expectations survey which was conducted in January this year and published on 7 February 2025. The survey again shows one year ahead expectation to be in the range of 10 per cent i.e at 10.2 per cent.
The survey was conducted in 19 major cities, with 6,096 valid responses, where female participation was 55.4 per cent.
The respondents are from financial sector employees, other employees, self-employed, homemakers, retired persons, daily workers, other category.
They are from various age groups – upto 25, 25-30, 30-35, 35-40 and so on, and are from different cities from Jammu to Thiruvananthapuram and from Guwahati to Ahmedabad.
The questions asked to the respondents were what they think will happen three-months and one-year ahead to the general prices, prices of food product, non-food prices, household durables, cost of housing and cost of services — whether the price will increase, price will increase more than current rate, price will increase similar to current rate, price will increase less than current rate, no changes in prices or decline in prices.
What Exactly Is Wrong Here
The RBI's monetary policy hinges on the idea that its measure of inflation expectations accurately predicts actual inflation and that these expectations drive wage adjustments. But we have seen that RBI's inflation expectations is nowhere close to the actual inflation numbers.
Now for the relationship between inflation expectations as measured by the RBI and the subsequent wage growth, Prof Tantri and Melanie Kurien in an article in Moneycontrol pointed out that their analysis of the data obtained on wages from the annual survey of industries showed no significant correlation between wage growth and the inflation expectations as measured by the RBI.
While the RBI's focus on maintaining stable inflation expectations is valid, the methods for measuring inflation expectations that guide its policy decisions are a cause for concern, Prof Tantri tells Swarajya.
RBI’s stance that food prices will lead to heightened inflation expectations overall and that higher interest rates will keep the demands in check, doesn’t add up. This is because in that case we will see higher unemployment levels, which are not reflected in employment surveys.
As per the RBI’s survey, the inflation expectations have consistently been high both in three-month ahead and one-year ahead data. But according to the latest Periodic Labour Force Survey (PLFS), the unemployment rate in India stands at 3.2 per cent for individuals aged 15 years and above, showing a decline from 6 per cent in 2017-18.
“Although one can question the quality of employment, the unemployment data (per se) is fine and correct. It is measured similar to how it is done everywhere else (in other countries), says Prof Tantri.
All other data points — actual inflation, RBI’s inflation forecast, Centre’s data on unemployment rate — seem to suggest one thing: RBI’s inflation expectations data is flawed.
Therefore, there is a dire need to get the inflation expectations data right and the current methodology for measuring these expectations needs urgent refinement, emphasises Prof Tantri.
'But, Others Have A Similar Way, Look At US'
Let’s look at Federal Reserve Bank of New York’s Survey of Consumer Expectations (SCE) data for inflation expectations. They follow, if not the same, a similar methodology as the RBI. But their results are almost accurate to the actual inflation.
For example: United States CPI inflation for Januray 2025 was at 3 per cent. And the inflation expectations as reported by Federal Reserve Bank of New York’s SCE data, showed that one-year ahead data for January 2025 (i.e measured in January 2024) was 3 per cent.
But how come US’ estimates for inflation expectations are closer to actual inflation?
To this, Prof Tantri says, this is simply because their population is more informed. In India’s case too, if you look at the corporate/business survey for inflation expectations measured by the Misra Centre at IIM-A, their data is closer to actual inflation (Graph 6). "But our population at large is not well informed, and so we cannot copy paste their (West) method".
The inflation targeting framework has worked well in developed nations because of their accurate measurement of inflation expectations, he adds.
Here’s how they measure inflation expectations: Their survey is based on a rotating panel of approximately 1,300 household heads which are grouped in demographic factors like:
age (below 40, 40-59, and above 50 years of age),
income (less than 50k, 50k-100k, more than 100k),
education (high school or less, some college, BA or higher),
numeracy i.e ability of individuals to understand and interpret numerical information related to inflation rates (low, high),
Regions (West, Midwest, South and Northeast).
The questions too are specific. For example: For inflation expectation they ask respondents to first answer this: “Over the next 12 months, do you think that there will be inflation or deflation? (Note: deflation is the opposite of inflation)”. Then depending on their response to this, they are next asked for a point estimate: “What do you expect the rate of [inflation/deflation] to be over the next 12 months? Please give your best guess”.
Earnings expectations, for those employed, are asked as follows: “Please think ahead to 12 months from now. Suppose that you are working in the exact same job at the same place you currently work, and working the exact same number of hours. What do you expect to have happened to your earnings on this job, before taxes and deductions?
-increase by 0% or more
-decrease by 0% or more”
This is then followed by: “By about what percent do you expect your earnings to have [increased/ decreased]?”
Their Staff Report on the SCE data mentions that respondents are not presented with a “stay the same” option when they are asked for a directional change. Instead, the instructions specify that they can enter a zero change by either picking the increase or decrease option.
When experimenting with question wording, they found that a substantial proportion of respondents would choose “stay the same” when that was presented as one of the options. Upon probing them further, they found that a substantial proportion of them had changes in mind that were bigger than 0.5 per cent in magnitude, suggesting that the mere availability of choosing the “stay the same” option was leading several respondents to pick it.
"In our analysis, we found that the distribution of responses to a given question with and without the “stay the same” option to be noticeably different," mentioned the report.
A similar approach can be taken by the RBI, to tweak questions that would lead towards better accuracy of the inflation expectations data.
What Would Be A Better Way For India
As mentioned above (Graph 3), the inflation expectations survey data of Misra Centre at IIM-Ahmedabad’s is closer to the actual inflation than that of the RBI, and one reason for that is that the former’s respondents are business leaders, hence a more informed group.
Their survey poses questions regarding cost expectations for the upcoming year and the factors influencing price changes, such as profit margins and sales levels. What makes this survey unique is that it targets businesses — the price setters — allowing for a better understanding of their expectations regarding price level changes.
Not only does it provide a probabilistic assessment of inflation expectations, it also indirectly evaluates the overall demand conditions in the economy.
Their result is based on 1,000 valid respondents — business leaders from across different fields such as manufacturing, construction, wholesale, retail traders, transport, supplies etc.
Now What?
Here are few measures that can help the RBI arrive at more accurate inflation expectation data:
--Identify loophole in the questionnaires. If there's a need for changing questions, and it’s framing, fix it.
--Include questions such as numeracy, relook at the various demographic factors.
--Survey both households and businesses — an integrated approach of HIES and BIES? This may give a more accurate assessment of inflation expectations.
--Include data of prices that are set up in advance. For instance look at the rate at which salaries, rent and school fees are increasing, look at contracts, at what rate prices are going up.
--Include investors, professional forecasters perspectives.
The RBI's inflations expectations survey deserves more attention in popular media because of its significant impact on the pockets and bank balance of Indians. Such an important survey cannot be allowed to return consistently inaccurate results.
Diksha Yadav is a senior sub editor at Swarajya.
Get Swarajya in your inbox.
Magazine