Economy
Why CMIE Cannot Be The Gold Standard On Jobs Data; It Has A Strong Skew
- Here are the reasons why we can’t completely trust CMIE jobs data.
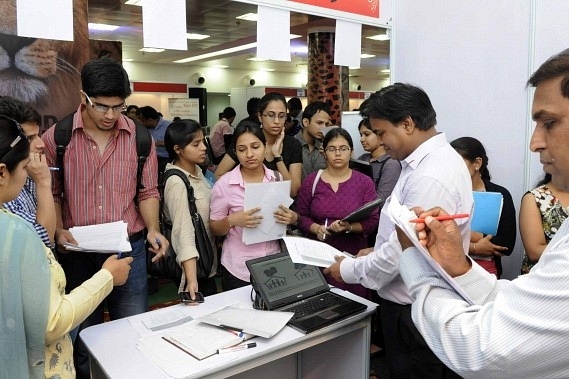
Students at a campus job fair organised by Delhi University Students Union in New Delhi. (Sushil Kumar/Hindustan Times via GettyImages)
A big bone of contention in this election year is unemployment data. In the absence of recent official surveys – the latest one done by the National Sample Survey Office (NSSO) is still to be officially released – the media and opposition politicians have chosen to use the only other survey that is available, the one provided by the Centre for Monitoring Indian Economy (CMIE).
Commendable though this private sector effort is, the question is: how reliable is the CMIE data? And are the numbers comparable to the official surveys done by the NSSO earlier? Or, for that matter, by Census 2011?
According to CMIE’s August-December 2018 survey (it can be downloaded from here) on employment and unemployment, these are the figures available.
The total number of employed Indians for the period is shown as 396.15 million, and the unemployment rate is shown as 6.68 per cent of the labour force. The survey has lots of other details, breaking up the same data by location (urban-rural), literacy, and gender, but these are the headline numbers we will compare for starters for authenticity.
A leaked report of the NSSO’s own estimate of unemployment, based on a survey done between July 2017 and June 2018, when the economic disruption of demonetisation and goods and services tax (GST) was at its worst, seems to corroborate this figure, and puts the unemployment rate at a 45-year-high of 6.1 per cent. The previous high was apparently in 1972-73, when the unemployment rate was 5.18 per cent.
Both figures, that of the CMIE and the leaked NSSO one, need to be taken with lots of caution, for they are estimates based on relatively small samples. The figures could be indicative of trends, but the absolute numbers and unemployment rates will be right or wrong depending on the assumptions made, which we will discuss later.
Now, let us compare these two figures (CMIE and NSSO) with the figures shown by Census 2011. Census figures are indisputable, for they are not estimates based on a self-selected sample, as in the case of the CMIE, but figures obtained by knocking on every door in the country.
If we accept the Census figures as the gold standard on employment and unemployment, this is what we get. The Census puts the total of “main workers” (or those with near full-time work) at 363.56 million, while “marginal workers” (those who got work only for a part of the year) added up to 119.32 million.
This gives us a total working population, both full-time and part-time, at 482.88 million.
So, the first question to ask of the CMIE numbers is this: is it possible that in the last eight years, India’s employed population shrank from 482.88 million to just 396.15 million – a sheer drop of more than 86 million jobs? We must be the most quiescent people in the world, for we can survive even with job destruction of this magnitude.
While the CMIE and Census definitions of employment may be different, this scale of difference is simply impossible. There is a huge probability that the CMIE’s absolute employment numbers are an underestimate.
Next, let’s come to the unemployment rate. Definitionally, unemployment is the total number of those actively seeking work as a percentage of the labour force, which itself is the sum of those employed and those actively seeking work.
CMIE’s unemployment rate is 6.88 per cent and the leaked NSSO’s rate is 6.1 per cent, allegedly a 45-year high.
Now consider the Census 2011 figures. It gives us two figures for those unemployed and actively seeking work. It is 60.7 million among those who are not working and actively seeking work, and 55.47 million for those who are marginal workers. The latter is probably an indication of underemployment, since they do have some work during the year.
If we take the labour force as the sum of those with full-time or part-time (marginal) work and those actively seeking work from among the non-workers, we get a figure of 538.35 million. The 60.7 million seeking work as a percentage of this labour force works out to an unemployment rate 11.27. And the 55.47 million among the marginal workers who are actively seeking work would work out to an underemployment rate of 10.3 per cent.
Whichever figure you take, and assuming you want to compare it to the CMIE or leaked NSSO rate, the real unemployment rate should be seen to have fallen dramatically from the Census 2011 figure.
We are, of course, comparing apples with oranges here, a full Census total with a sample estimate, but if estimates are nowhere near the full Census figure, surely one should ask how valid are these estimates?
The second problem with the CMIE number is the huge weightage it gives to urban households as compared to the NSSO.
The CMIE’s August-December 2018 survey covered 173,181 households with 522,000 individuals in the 15-plus age group. The urban sample is 110,615 households while the rural one is 62,566. A 63 per cent skew in favour or urban households would be difficult to justify if we assume that the official urban population is just over 31 per cent.
Now compare this with the older NSSO survey of 2011 (you can download it from here; it is not the leaked one from 2017-18), which had a smaller sample size of 101,724 households with 456,999 individuals. In this sample, rural households totalled 59,700 and urban ones 42,024 – a skew in favour of rural areas and probably more representative of the country’s reality.
It is difficult to believe that this skew did not have an impact on employment-unemployment figures in the CMIE’s data.
One reason for the CMIE’s urban skew is that its employment-unemployment data is a subset of its main data collection focus, which is the Consumer Pyramids database, which generates subscription revenues. The Consumer Pyramids website claims to be the “largest survey of households in India. It makes estimates of income, expenses, savings, borrowings, investments and ownership of assets of households. It also makes estimates of the age, gender, education, occupation, health and financial inclusion of individuals.”
These details are important to companies seeking to develop marketing plans for their products and services. Since urban areas are central to marketing, the skew is understandable.
But one wonders if its urban-centric bias has impacted the authenticity of its estimates on employment and unemployment in general.
Looking at the numbers from Census 2011 and the design of the NSSO surveys, the answer seems to be yes.
(This is a first in a series of articles on India’s jobs challenge, and the importance or relevance of current and new data sources)
Support Swarajya's 50 Ground Reports Project & Sponsor A Story
Every general election Swarajya does a 50 ground reports project.
Aimed only at serious readers and those who appreciate the nuances of political undercurrents, the project provides a sense of India's electoral landscape. As you know, these reports are produced after considerable investment of travel, time and effort on the ground.
This time too we've kicked off the project in style and have covered over 30 constituencies already. If you're someone who appreciates such work and have enjoyed our coverage please consider sponsoring a ground report for just Rs 2999 to Rs 19,999 - it goes a long way in helping us produce more quality reportage.
You can also back this project by becoming a subscriber for as little as Rs 999 - so do click on this links and choose a plan that suits you and back us.
Click below to contribute.
Latest