Featured
8 Charts To Understand India’s Poor Agriculture Productivity
- Eight charts will help you better understand Agriculture in India.

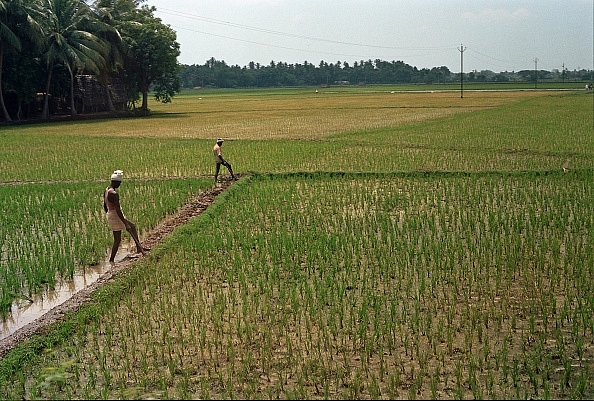
Irrigation/Getty Images
#1 Distribution Of Gross Cropped Area Across Major Crops
#2 Distribution Of Gross Cropped Area Across Major Cereals
#3 Area Under Foodgrain Production
#4 Foodgrain Yield Per Hectare Across India
#5 Rice Yield Per Hectare Across The World
#6 Wheat Yield Per Hectare Across The World
#7 Potato Yield Per Hectare Across The World
#8 Banana Yield Per Hectare Across The World
Data From Niti Ayog
Support Swarajya's 50 Ground Reports Project & Sponsor A Story
Every general election Swarajya does a 50 ground reports project.
Aimed only at serious readers and those who appreciate the nuances of political undercurrents, the project provides a sense of India's electoral landscape. As you know, these reports are produced after considerable investment of travel, time and effort on the ground.
This time too we've kicked off the project in style and have covered over 30 constituencies already. If you're someone who appreciates such work and have enjoyed our coverage please consider sponsoring a ground report for just Rs 2999 to Rs 19,999 - it goes a long way in helping us produce more quality reportage.
You can also back this project by becoming a subscriber for as little as Rs 999 - so do click on this links and choose a plan that suits you and back us.
Click below to contribute.
Latest