Ideas
How Indian States May Have Undercounted Covid-19 Deaths By A Factor Of 2x To 14x In The Second Wave
Arihant Pawariya
May 27, 2021, 07:26 PM | Updated May 28, 2021, 08:58 AM IST
Save & read from anywhere!
Bookmark stories for easy access on any device or the Swarajya app.


It was the Hindi daily Dainik Bhaskar which started questioning the official Covid-19 fatality data in Madhya Pradesh last year after its reporters started comparing the reported figures with the funerals in some areas that were being carried out as per the protocol laid out by the authorities for last rites of those dying from the coronavirus. The gap was substantial.
Before this, while many doubted the numbers, they didn’t have a decent method to make intelligent guesses about the scale of the underreporting.
When the second wave hit, many more journalists from various publications started looking at cremations in cities to estimate the true mortality or the gap between real death figures and those reported by the government. But no matter how many journalists one deploys at crematoriums, one can only get limited data - say a village, city or district at best. And that cannot be extrapolated for the whole State let alone the whole country.
Interestingly, it was Bhaskar again, this time the Gujarat edition of the paper, which dug out data on death certificates for 1 April-10 May period for 2021 and previous years for various municipal corporations in the state which informs us that the scary estimates of underreporting by a factor of 10x might actually be true (at least during the course of the second wave, if not overall).
While the above method appears to be the most robust way of finding the true mortality due to Covid-19 across the country, it would take time before the data is made available by all the local governments provided, of course, that this won’t be fudged.
Meanwhile, everyone is trying to guess the scale of underreporting using various ways. After reading a lot of material on this, I found that no one has used the positivity rate (number of reported infections/number of tests) as a pointer to make an informed estimate about the missing numbers which is surprising because this is understood to be a very good pointer in understanding the scale of the spread of virus transmission in a particular area.
High positivity rate means two things:
a) the transmission and spread of infection is very high and,
b) the testing is not sufficient to detect all those who have been infected by the virus.
The World Health Organisation recommends that five per cent positivity rate should be taken as a criterion to understand that the virus is under control and if this rate is maintained for two weeks, restrictions can be lifted.
This doesn’t mean that at this rate, we would catch all those who are positive. Some experts have argued to take the positivity rate to less than three or even lower.
But let’s assume for the purpose of this article that five per cent positivity rate is good enough to detect all possible cases and take this as base to calculate the missing infections (and deaths) from the official data during India’s second wave.
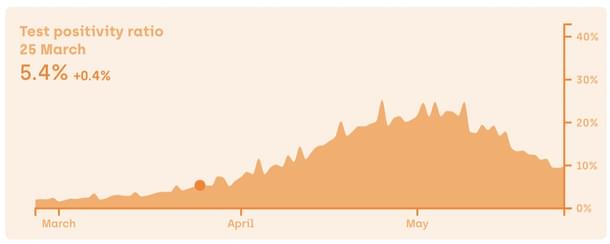
Below is the curve of positivity rate for the country during the devastating wave which has not yet subsided nationally (even though it has in some states which were driving the pandemic earlier):

As one can see, test positivity rate went over the five per cent figure on 25 March and has come down to just below 10 per cent yesterday after hitting a peak of 25.3 per cent on 25 April.
During this period (25 March to 26 May), average positivity rate comes to 15.67 (total number of infections were 1,55,90,777; total tests were 9,94,65,471). Taking five per cent positivity rate as base, we can say that during this period, underreporting was by a factor 3.13x hence total number of infections would also be 3.13 times higher and so would be number of deaths. So, we can say that 4,84,325 people would’ve likely dead instead of officially reported 1,54,539.
(Here again, the assumptions are crude. For instance, we assume for simplicity that infections rise linearly with rise in positivity rate which cannot be the case. Moreover, we assume that CFR would also rise linearly with rise in infections when it could actually increase manifold once medical infra comes under stress)
Anyway, national data has too much noise and less signal.
The government of India doesn’t report the death figures, States do (which means that the claim of Rahul Gandhi that the Government of India is lying about death figures cannot possible be true). If there is genuine undercounting or fudging of the data, it would solely be because of the State governments not because of the Centre.
Nonetheless, to get a better picture, it’s important to look at the States worst affected during the second wave of the pandemic and try to estimate the level of undercounting.
Below is the list of thirteen most badly hit states in the last four months. Total infections, total tests, deaths and positivity rate for a specific period (when their positivity rate was above five per cent) are given and the factor of undercounting is calculated based on the available data.

Using positivity rate, we estimate that undercounting of deaths could be as high as to a level 5x in West Bengal to as low as 2x in Punjab.
These estimates reached at using the positivity rate are conservative because we have taken a higher base of five per cent rate. If we were to take three per cent positivity rate as base, then the undercounting for West Bengal would be over 8x.
On top of this, there were so many false negatives in this wave for some reason - those with Covid-19 symptoms were showing up negative in the RT-PCR reports. This was happening at such a scale that the governments had to change their criterion of furnishing mandatory positive report for hospitalisation.
Additionally, the variants in this wave were far more infectious. The scientific verdict may be still out if they were more virulent but anecdotal evidence certainly tells us that. The infectiousness itself makes the pandemic more virulent in terms of deaths because the probability of the virus catching the vulnerable people is much more. The quantity itself has own quality as the saying goes.
Moreover, this time around, the hospital infrastructure crumbled like never before. A lot of people, who would’ve otherwise survived, died because they didn’t get the required care.
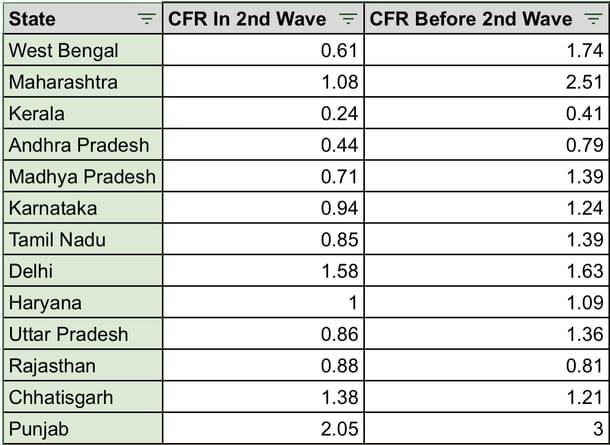
But for some strange reason, almost every State, in their official data, is showing mortality rate as much lower in second wave than before.
See the table below:

The difference for some states is so huge that one is left with no option but to seriously consider accusing the States of ‘fudging’ the data.
While high positivity rate tells us about lack of testing which is a proxy for incompetence (hence the missing numbers are referred as ‘undercounting’), such stark drop in case fatality rates in the second wave when hospital infra was crumbling and variants were more problematic is clearly unbelievable. Probably the States forgot to fudge their infections and deaths cleverly and ended up with such CFR figures.
In Maharashtra, CFR fell from 2.51 earlier to 1.08, a stunning decline of 56 per cent. Maybe the Shiv Sena government would like to share the mysterious and medical wonder they found to achieve such results.
West Bengal’s achievement of fall of almost 65 per cent in CFR is even a bigger wonder. Fall of around 49 per cent in Madhya Pradesh, 46 per cent in Punjab, 41 per cent in Kerala, 38 per cent in Tamil Nadu and 36 per cent in Uttar Pradesh are equally commendable.
These states should definitely share the secret with the likes of Chhattisgarh and Rajasthan where CFR increased in the second wave or states like Delhi and Haryana where CFR remained almost the same as before.
If we estimate the possible deaths assuming that CFR remained the same as before (when most likely it would’ve gone up), then we get the table below with undercounting factor as high as 14.5x for West Bengal to as low as 3.1x for Punjab.

This would also be a conservative estimate because it’s hard to believe that CFR would have varied as much within a country as it did in India before this wave - from as low as 0.41 in Kerala to a high of 3 in Punjab. Such huge variations are most likely a result of fudging of data whether it’s infections or deaths.
The CFR numbers just don’t make any sense even when we consider them region-wise.
In southern India, CFR varied greatly from 0.41 in Kerala to 1.39 in Tamil Nadu (before the second wave).
Maharashtra and Gujarat (where pandemic was largely driven by urban nature of their population) had CFR of 2.51 and 1.35 respectively.
Similarly, Punjab and Haryana had such huge difference with CFR of 3 and 1.09 respectively.
In Rajasthan, CFR was 0.81 while it was 1.39 in neighbouring Madhya Pradesh.
Coming back to the likely deaths during the second wave, we estimate a total of 6,39,930 excess deaths in 13 States (rest have been excluded due to too few numbers) - undercounting by a factor of 6x.
This would take us easily close to the figure of one million deaths in total - undercounting by a factor of 3x (assuming that there was no undercounting before the second wave). Interestingly, 3x was exactly the factor of undercounting during the Spanish Flu pandemic in India.
I maintain that this is a conservative figure as explained above. If the States have lied about their earlier CFR, then the mortality figures would change. Remember that the world‘s average CFR is over two per cent while states like Kerala want us to believe that their CFR was 0.4 in first wave and is 0.24 in second wave.
Anyway, all that is conjecture. What we can say with some confidence is that the model presented here is pointing towards mortality figure north of a million people. And it’s a conservative estimate.
Arihant Pawariya is Senior Editor, Swarajya.


