Lite
Five Charts To Understand Urban India's Political Landscape
Swarajya Staff
Jun 26, 2015, 12:01 AM | Updated Feb 11, 2016, 10:19 AM IST
Save & read from anywhere!
Bookmark stories for easy access on any device or the Swarajya app.

Prime Minister Narendra Modi today unveiled his grand vision of Urbanisation. Three flagship programs that promise to transform India’s urban landscape have been envisaged – Pradhan Mantri Awas Yojana (PMAY) housing scheme, Smart Cities Mission and the Atal Mission for Rejuvenation and Urban Transformation (AMRUT) urban renewal initiative.
Urban India overwhelmingly voted for the NDA in the 2014 Lok Sabha election as the Modi wave not only helped BJP regain its traditional urban pocket-boroughs (lost to UPA in 2009) but also make new inroads. However the success of Modi’s ambitious programs depend on the effective delivery by state governments and municipal corporations.
Through the following 5 charts we try to find out the extent of BJP’s hold over Indian cities – at state and municipal levels. A very interesting picture emerges.
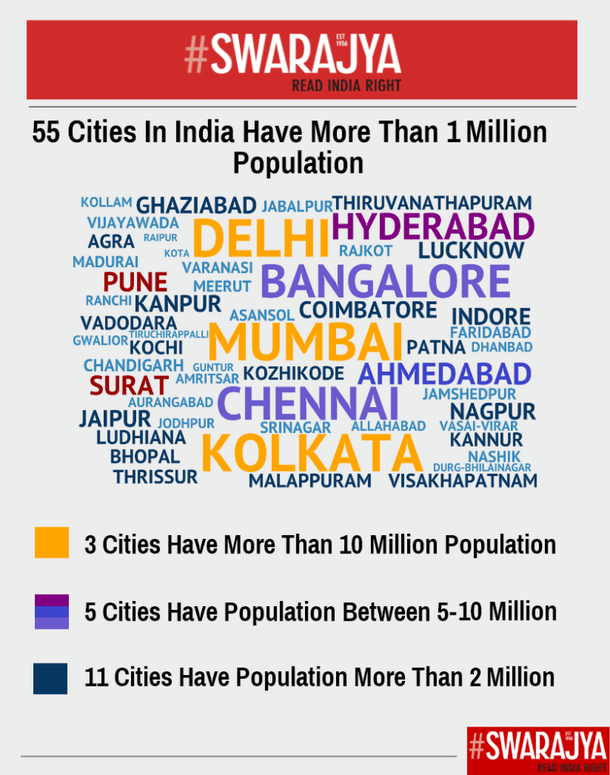
Chart 1 -India’s Largest Cities
–
–
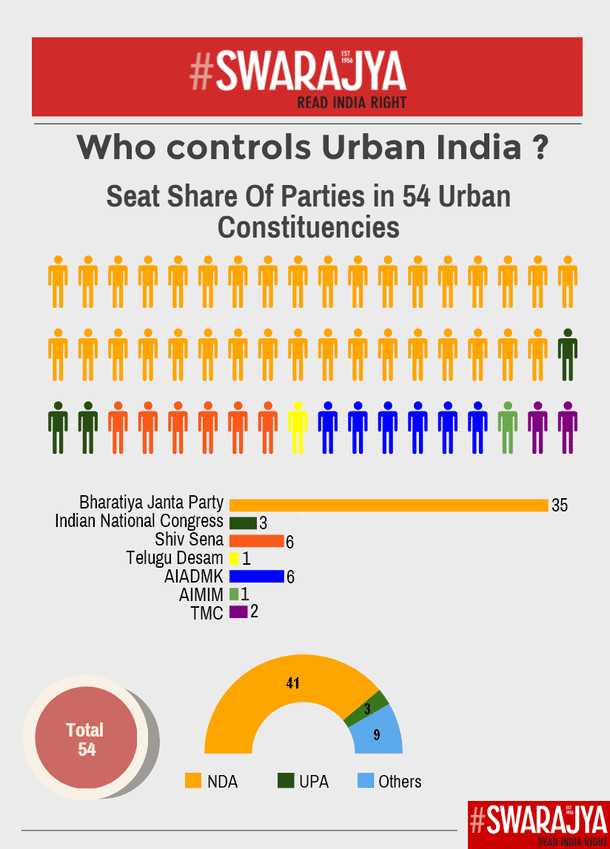
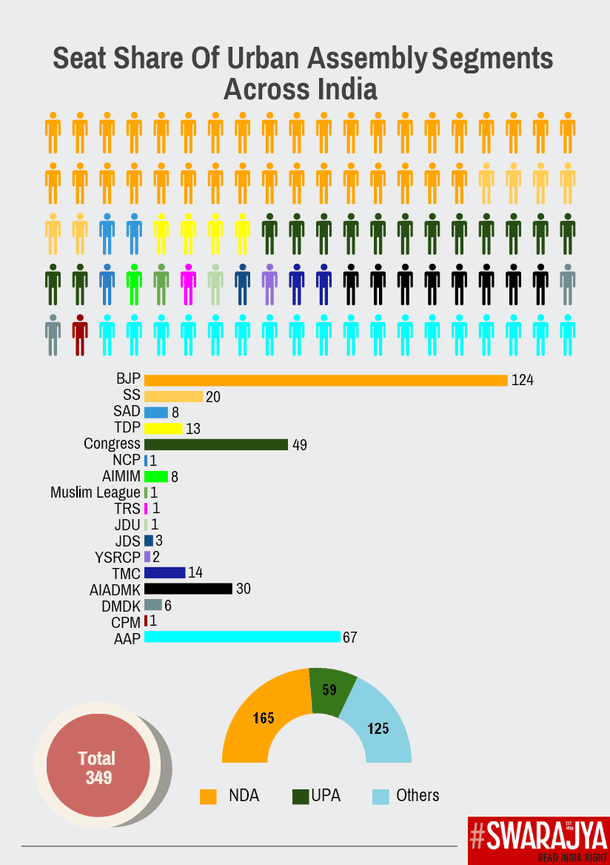
Chart 3 – How Parties Perform in Urban Assembly Segments
–
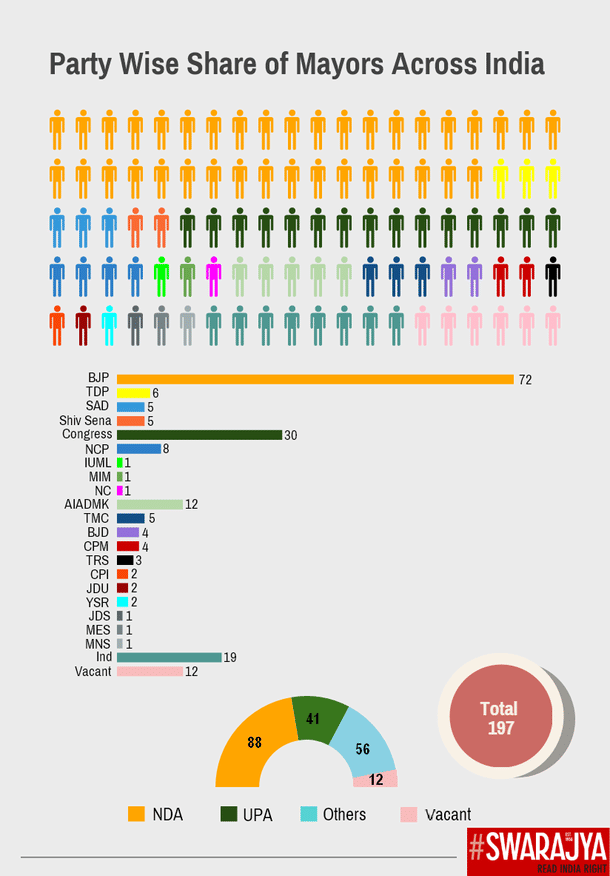
Chart 4 – Where are the Mayors from?
–
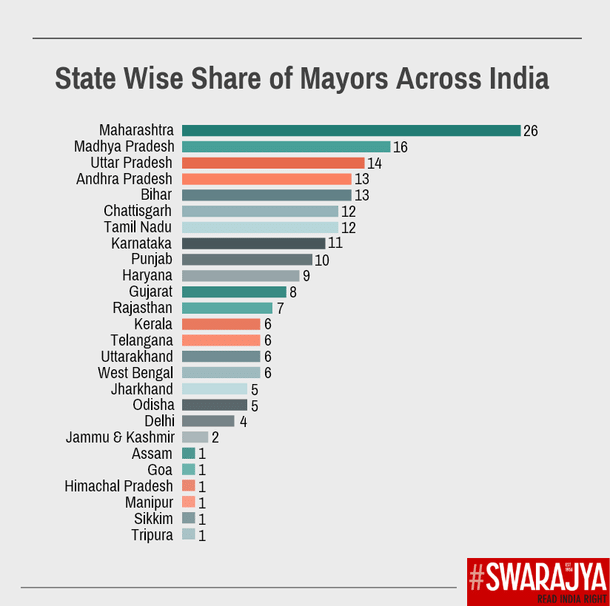
Chart 5. Which state has most mayors?
Get Swarajya in your inbox.
Magazine