News Brief
Economic Survey 2025 Flags Uneven Industrial Growth Among States: Details Here
Vansh Gupta
Jan 31, 2025, 06:10 PM | Updated 06:10 PM IST
Save & read from anywhere!
Bookmark stories for easy access on any device or the Swarajya app.


The Economic Survey 2025 provides key insights into India’s industrial landscape through various data-driven analyses.
The following graphs highlight major disparities in industrial development across states, showing that a high reliance on industry does not always lead to high incomes.
They reveal how mining remains concentrated in a few states, manufacturing is unevenly distributed, and ease of doing business reforms influence industrial growth.
Additionally, the data suggests that some states must formalise and scale their smaller enterprises for better economic outcomes.
These findings emphasise the need for balanced industrial policies, deregulation, and infrastructure improvements to drive sustainable growth across India. Let's see them one by one.
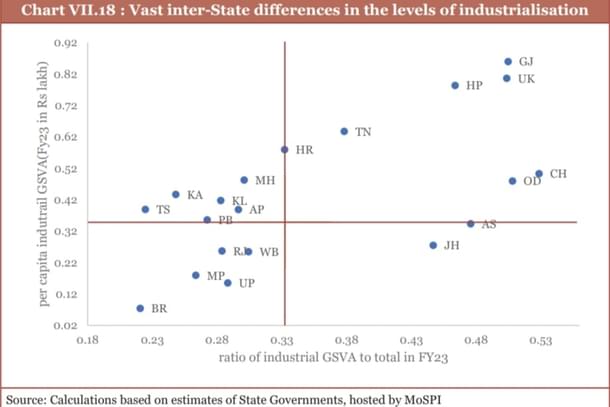
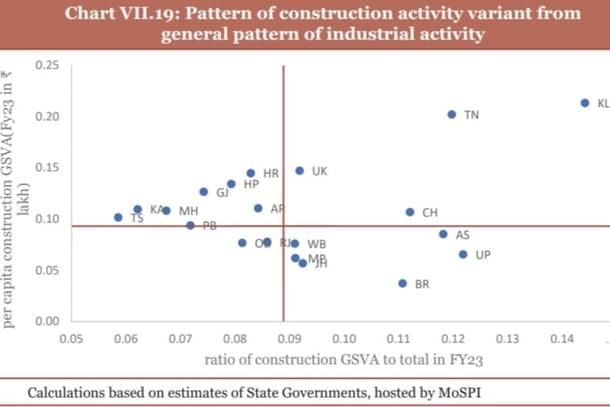
1. Industrial Dependence vs. Industrial Development (Chart I)
A high dependence on the industrial sector does not always translate into high levels of industrial development.
Chart I reveals that states exhibit significant variations in per capita industrial Gross State Value Added (GSVA) despite their industrial sector’s share in total GVA.
States like Gujarat, Uttarakhand, and Himachal Pradesh effectively leverage their industrial dependence to generate substantial income.
The data also highlights low industrialisation levels in northern and eastern states, indicating structural gaps in development.
Interestingly, Kerala emerges as an outlier, demonstrating strong construction sector activity, despite being less industrialised than many other states.
2. Sectoral Specialisation and Mining Concentration (Chart II)
The industrial patterns across states largely reflect their comparative advantages, but the data underscores that many states remain dependent on low-income generating industries.
This slows structural transformation and prevents surplus agricultural labor from shifting to higher-value sectors.
Mining, a critical industrial segment, accounts for 8 per cent of total industrial output but remains highly concentrated in just five states—Assam, Chhattisgarh, Gujarat, Maharashtra, and Odisha—contributing 60 per cent of total mining GSVA.
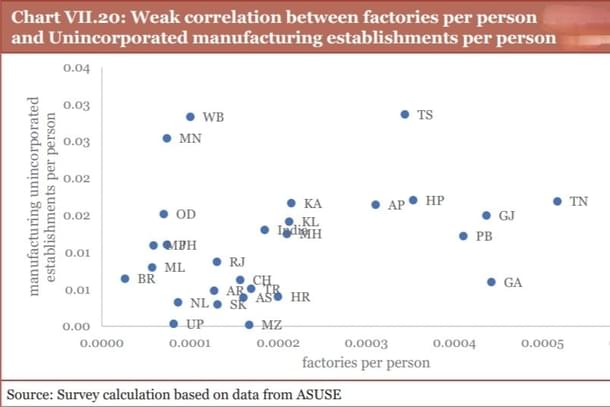
3. Disparities in Manufacturing and Factory Distribution (Chart III)
The Annual Survey of Industries (FY23) and ASUSE Survey (FY23) highlight vast inter-state differences in factory and enterprise density.
Tamil Nadu leads with the highest concentration of factories per person, followed by Gujarat, signifying a robust manufacturing ecosystem.
In contrast, Bihar has an extremely low factory presence, while Uttar Pradesh has minimal small-scale enterprises, reflecting stark industrial gaps
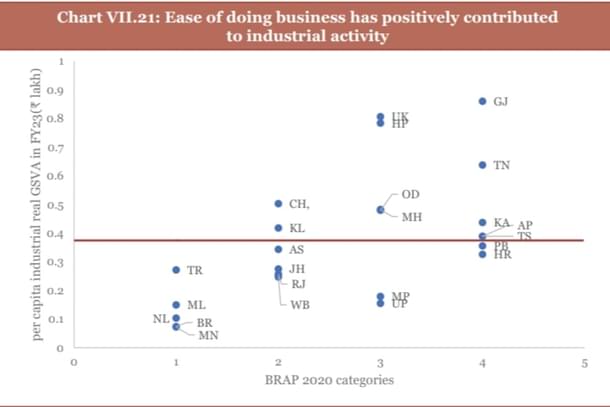
4. Ease of Doing Business and Industrial Growth (Chart IV)
The Business Reform Action Plan (BRAP) 2020, formulated by the Department for Promotion of Industry and Internal Trade (DPIIT), categorises states based on ease of doing business into top achievers, achievers, aspirers, and emerging business ecosystems.
Chart IV reveals a strong link between business reforms and industrial activity, reinforcing the need for deregulation, enterprise-friendly policies, and streamlined industrial reforms.
Vansh Gupta is an Editorial Associate at Swarajya.
Get Swarajya in your inbox.
Magazine