Commentary
Delhi Assembly Elections 2013 - A Opinion Poll
Chinmay Krovvidi
Sep 18, 2013, 10:34 PM | Updated Apr 29, 2016, 01:19 PM IST
Save & read from anywhere!
Bookmark stories for easy access on any device or the Swarajya app.

Delhi opinion poll-2013
Are you satisfied with the performance of the Congress government in the state?
Yes | 31% |
No | 48% |
Do you think Sheila Dixit Government deserves another chance?
Yes | 34% |
No | 43% |
How do you rate the performance of the state government?
Excellent | 7% |
Good | 16% |
Average | 33% |
Poor | 19% |
What are the issues which affect you the most as a voter?
Price Rise/Inflation | 31% |
Crime | 25% |
Corruption | 23% |
Unemployment | 8% |
Are you satisfied with the performance of UPA Government at Center?
No | 62% |
Yes | 21% |
Report card of the State Government
| Issue | Improved | Decreased/ Deteriorated | Remain the same |
| Condition of roads | 38% | 29% | 15% |
| Employment Opportunities | 27% | 41% | 18% |
| Corruption | 47% | 19% | 24% |
| Condition of public hospitals and medical facilities | 27% | 25% | 28% |
| Electricity Supply | 31% | 37% | 20% |
| Safety of women | 20% | 44% | 27% |
| Quality of education | 32% | 30% | 30% |
| Transportation facilities | 29% | 23% | 32% |
What are the factors /issues which could influence your voting preference?
| Performance of State Government | 31% |
| Performance of sitting MLA | 19% |
| Performance of Chief Minister | 11% |
| Performance of Union Government | 17% |
| Caste of the candidate | 12% |
Do you think Manmohan Singh needs to be re-elected?
No | 67% |
Yes | 19% |
Do you give weight age to party or leader while voting in election?
Leader | 29% |
Party | 25% |
Both | 36% |
Electoral preferences of various social/demographic groups
| Category | BJP | Congress | AAP | BSP |
| Young Voters | 35% | 23% | 22% | 11% |
| College Goers | 36% | 25% | 23% | 7% |
| Uneducated | 26% | 35% | 12% | 14% |
| Women voters | 32% | 25% | 15% | 12% |
| Middle aged men | 29% | 27% | 17% | 13% |
| Migrant Labour | 23% | 37% | 9% | 16% |
| Slum Dwellers | 26% | 33% | 13% | 15% |
*Congress has edge among uneducated, slum dwellers and migrant voters while BJP more popular among young voters, college goers, trading community and women voters
*Aam Admi Party is preferred by significant chunk of educated youth and middle aged men and a section of slum dwellers.
*Urban and working women preferring BJP compared to Congress
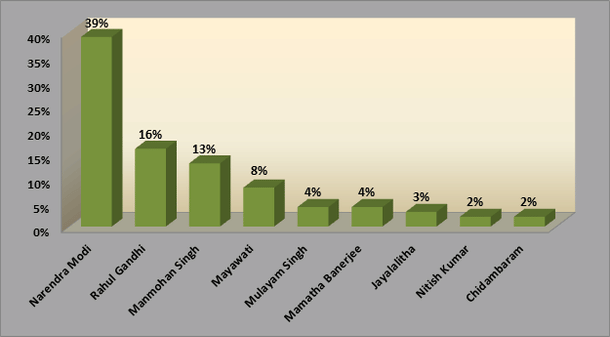
Who do you prefer as the next Prime Minister of India?
| Narendra Modi | 39% |
| Rahul Gandhi | 16% |
| Manmohan Singh | 13% |
| Mayawati | 8% |
| Mamatha Banerjee | 4% |
| Mulayam Singh Yadav | 4% |
| Jayalalitha | 3% |
| Nitish Kumar | 2% |
| Chidambaram | 2% |
*Modi is the most preferred choice for PM post at 39% followed at distant second by Rahul Gandhi.Modi more popular among first time voters, young college goers, women and middle class
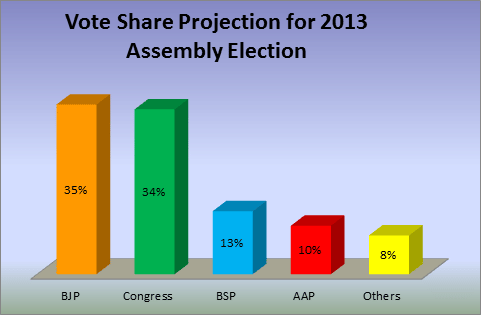
| Party | Vote share (2008) | Seat share (2008) | Vote Share (2013) | Seat Share (2013) |
| BJP | 36.34% | 23 | 35%(-1.34) | 33(+10) |
| Congress | 40.31% | 43 | 34%(-6.31) | 30(-13) |
| BSP | 14.05% | 2 | 13%(-1.05) | 2(0) |
| AAP | – | – | 10%(+9) | 3(+3) |
| Others | 9.3% | 2 | 8%(-1.3) | 2(0) |
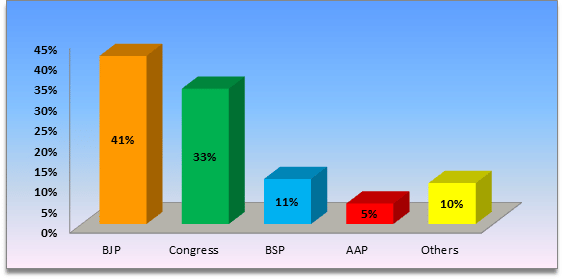
Vote Share projection for 2013 Assembly election
Seat projection for 2013 Assembly elections
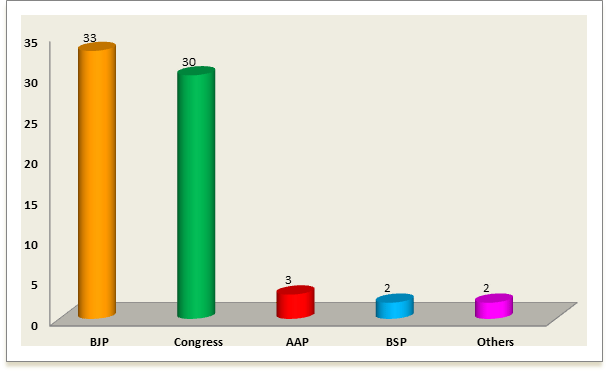
*Swing of 6.31% of vote away from Congress compared to 2008 Assembly election.The party is likely to lose 13 seats from 2008 elections. Nearly a third of sitting Congress MLA’s facing anti incumbency.
*BJP largely retaining its core vote but the party vote share is likely to decline to 34% from 35.14%.The party is gaining 10 seats compared to 2008.
*AAP is likely to poll close to 10% vote but could end up behind BSP which is holding onto its traditional vote.
*Sheila Dikshit remains most popular choice for CM post.
*BJP’s inability to project a strong CM face is unlikely to significantly impact its poll prospects as the party is beneficiary of the anti incumbency sentiment.
*Performance of state government relatively positive when compared with that of the Union Government
*Poor ratings of the Union Government likely to impact Congress performance in the upcoming election.
*BJP vote share could go up by 6% in Lok Sabha election compared to the Assembly elections
*Close race between BJP and Congress but slight edge for BJP.
Are you satisfied with the performance of your sitting MLA?
Yes | 42% |
No | 47% |
Satisfaction index of sitting MLA’s of major parties
BJP | 0.7 |
Congress | 0.5 |
BSP | 0.8 |
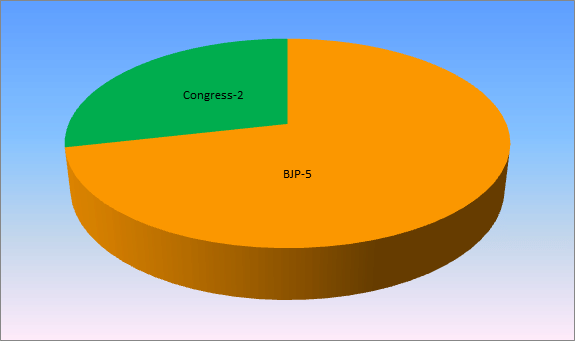
Seat and Vote share for Lok Sabha Election
Party | Vote share (2013) | Seat Share (2013) |
BJP | 41% | 5 |
Congress | 33% | 2 |
BSP | 9% | – |
AAP | 5% | – |
Do you agree that the hike in electricity tariff is justified?
No | 61% |
Yes | 22% |
Vote Share Projection for Lok Sabha election
Which party do you think can provide better governance?
BJP | 32% |
Congress | 29% |
Aam Admi Party | 18% |
BSP | 10% |
Seat share projections for Lok Sabha election
Which party do you think can bring down price rise and food inflation?
BJP | 34% |
Congress | 25% |
AAP | 19% |
Whom do you prefer as the Chief Minister of Delhi?
Sheila Dikshit | 22% |
Arvind Kejriwal | 16% |
Vijay Goel | 14% |
Dr.Harshvardhan | 9% |
Ajay Maken | 5% |
Smriti Irani | 3% |
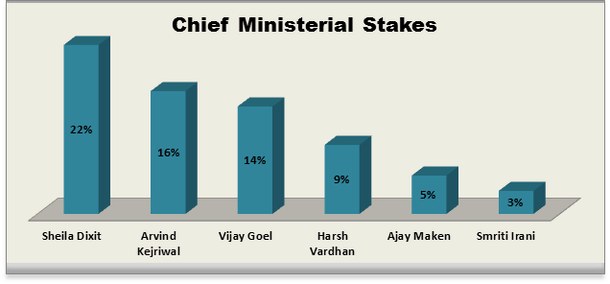
*Shiela Dikshit remains the popular choice for Chief Ministerial seat at 22% followed by Arvind Kejriwal at 16%.Vijay Goel is the preferred choice from BJP for CM post.36% of BJP voters want Vijay Goel as next CM of Delhi
*The field work for the survey was carried from September 2nd to 7th
*A total of 823 respondents from 21 Assembly constituencies spread over 73 polling booths were interviewed during the field work.
*The respondents were provided with questionnaire in both English and Hindi depending upon the ease of convenience of understanding.
*The survey sample has cross sectional representation of the major caste and social groups proportional to the 2001 census figures.
*If the fugues don’t add upto 100% its due to the respondents either favoring options not given in the questionnaire and some having no opinion on the question posed.
*The margin of the error is +/- 3%
(Image Courtesy- India Today)
Get Swarajya in your inbox.
Magazine