Economy
India’s PPP GDP Growth: Is This The Most Underrated Part Of Its Economic Story?
Suraj S
Apr 19, 2025, 01:11 PM | Updated Jun 02, 2025, 11:34 AM IST
Save & read from anywhere!
Bookmark stories for easy access on any device or the Swarajya app.
It is now 25 years into the new century. India has developed significantly over the course of this time.
This development is described in many ways. The commonest economic metric is the Gross Domestic Product or GDP - the aggregate value of goods & services produced in an economy in a year.
The term “value” here is a loaded one. What does value mean when things do not have the same price everywhere in the world ? Simply converting all local currencies to the US dollar at prevailing exchange rates - called the nominal GDP - therefore does not work, especially at an individual level. To address this, the GDP at Purchasing Power Parity (PPP) was introduced.
The normalisation of the cost of goods and services in terms of purchasing power is particularly critical when one considers just how much purchasing power varies. The simplistic thinking is that all developed countries have a generally similar purchasing power and developing countries all fit in a different more affordable basket. But reality is different. The following is the ratio between purchasing power based GDP and nominal (exchange rate based) GDP for some major economies.
It’s clear that while major developed nations all have purchasing power multipliers within a reasonable range, developing countries are widely spread apart, not just amongst themselves, but versus developed countries.
What does this mean ? Practically this implies that the cost of living in India is broadly a quarter of that in the US. Seen at an individual level, the average person has the ability to buy far more than the value of his rupee income looks like in US dollars within India. In the rest of this article we will look at how India’s GDP in PPP terms has evolved over time and how it relates to standard of living.
A Comparative Visual Timeline of Growth
Data for PPP GDP has been published for about 40-45 years now. It provides a fascinating insight into India’s evolution in terms of individual purchasing power in that period. Let’s rewind the clock back to 1985. India had just over half of today’s population - 780 million. The following image shows India's per capita income in PPP terms compared to various nations in Africa.
Green indicates that the country in question was richer in terms of PPP GDP on a per capita basis. Red indicates India ranked higher. Cream indicates near parity.
This was the reality then - despite having only half of the population today, India had the same per capita purchasing power as Chad. Almost all of Africa was richer, including most of its poorest part - Sub-Saharan Africa.
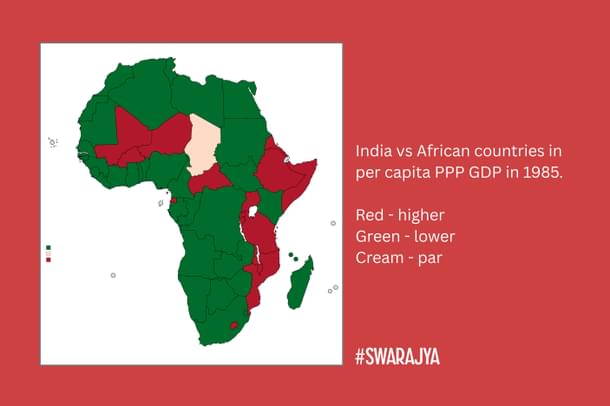
Sudan, Nigeria, DR Congo all had higher per capita incomes than India back in 1985. Fast forward to the year 2000, and the change is slight. Sudan and Nigeria were still richer per capita, though India overtook DR Congo among a few others. India still had a per capita purchasing power around that of the median of sub-Saharan Africa, after almost a decade following liberalisation:
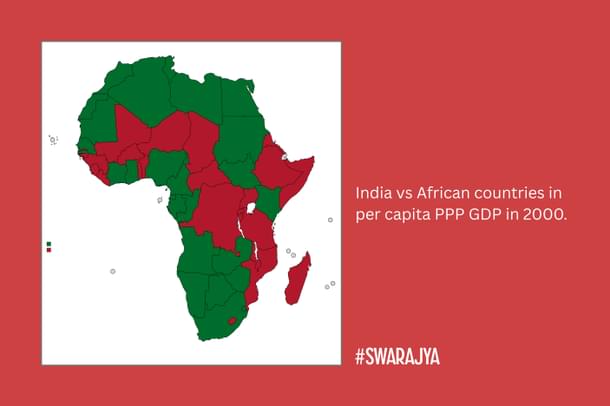
Only a map of Africa is relevant at this point - there was no country in all the Americas - not even Haiti - that was poorer than India then. Certainly not Europe.
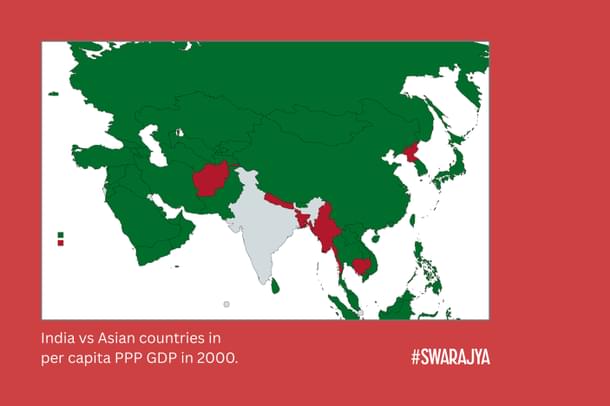
In Asia there are a handful of countries with lower per capita income - Afghanistan, Nepal, Bangladesh, North Korea and Cambodia. In 2000, Pakistan had a higher PPP GDP than China did - both far ahead of India.
To see early signs of real development we have to fast forward to 2015. This is how the picture looks like for Africa.
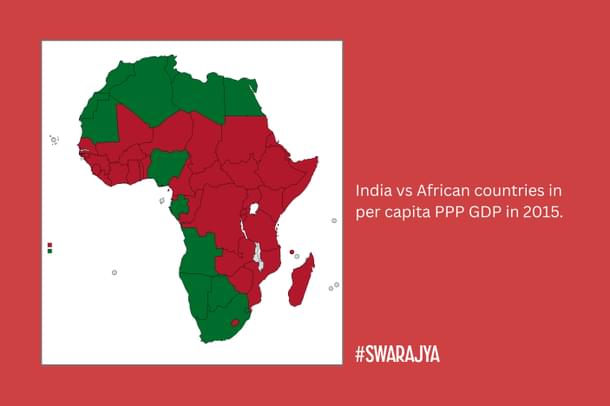
In effect, 2015 is the first time India isn’t really comparable to sub-Saharan Africa anymore. Only Nigeria - driven by oil revenue - and Gabon are wealthier. India also over took a couple of American countries - Haiti and Honduras. But this is quite hard to see yet.
In 2015 India has slowly shed equivalence to Sub-Saharan Africa, and started to catch up to the bottom tier of the Americas in PPP GDP per capita. This was after close to 25 years of liberalization. In effect, Indian GDP growth at lower income levels was good but not groundbreaking. Now let us look at 2025 - the present day.
Between 2015 and 2025, India’s PPP GDP per capita increased from $5430 to $12000 - 2.2x in a decade. This compares to an increase from $780 in 1985 to $2090 in the year 2000 - a 2.7x gain in 15 years, and to $5430 in 2015 - a 2.6x gain in the next 15 years. In other words, Indian PPP GDP per capita has risen faster than long term average in the past decade. How did this impact the picture of how India compares in terms of relative purchasing power of an individual to other continents visually ?
Let’s start with Africa again:
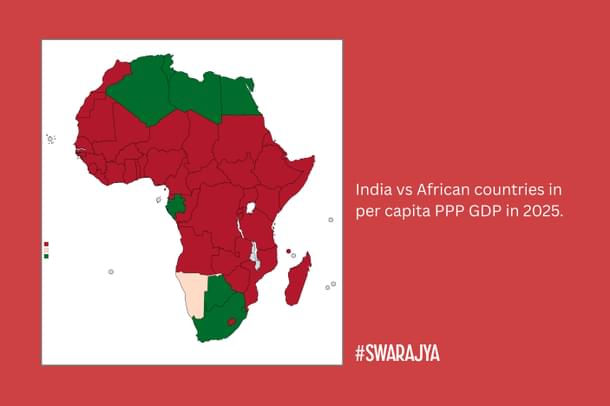
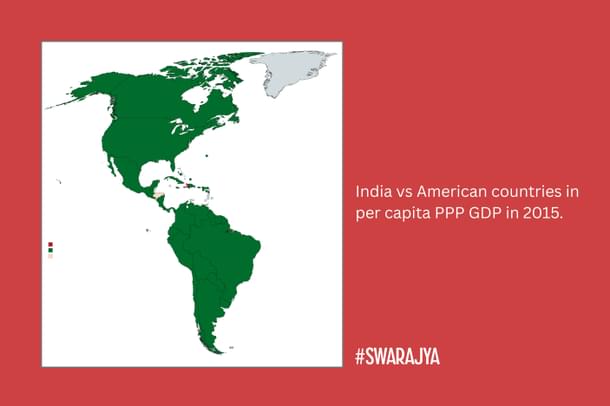
The picture is now substantially different from a decade ago. The average Indian has higher purchasing power than most of Africa - on par with Namibia and not far behind South Africa. The picture in the Americas is also dramatically changed:
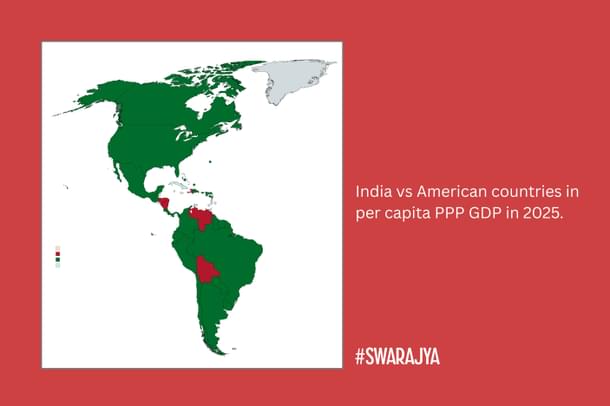
India has higher purchasing power per capita than Bolivia, Venezuela and Nicaragua, approaching El Salvador, Ecuador and Paraguay. The same trend is now visible in Asia:
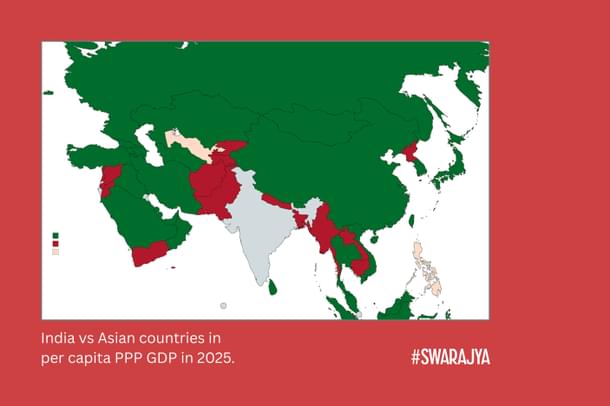
India has a higher per capita GDP in PPP terms than several more countries including Tajikistan and Kyrgyzstan, on par with Uzbekistan and the Philippines. Versus the ASEAN, India ranks middle of the pack today. A closer look at the Middle East:
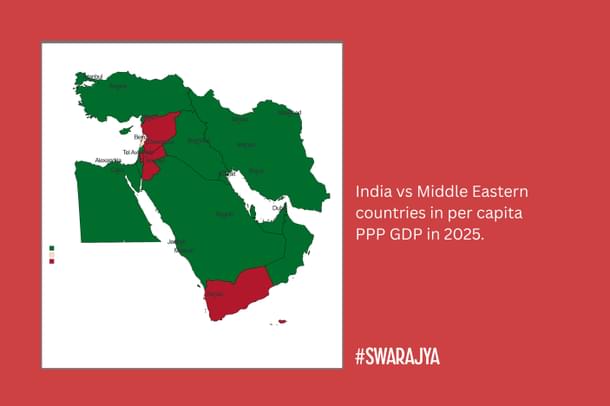
India has a per capita PPP GDP on par with Lebanon, exceeding Yemen, Syria, Palestine and Jordan.
This progress is sometimes characterized negatively as “those are mostly war-torn countries, it’s not a big deal”. But it is - India was so far behind the curve that it took until 2025 to get here. As recently as the mid 2000s, India was still trending on par with Sub-Saharan Africa in terms of per capita PPP GDP and Human Development Index (HDI) - in fact India entered the ranks of High HDI in 2025 as well.
An Accelerating Trend
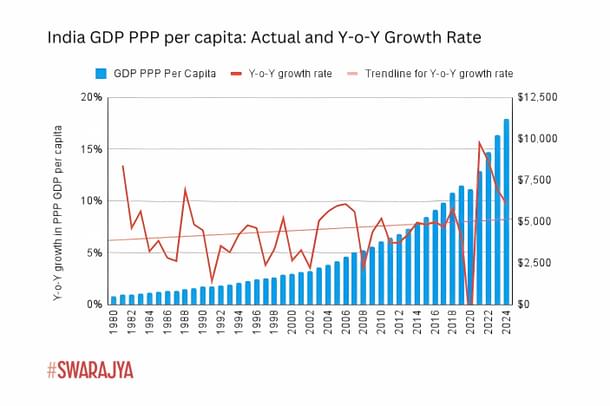
An implicit message in the above visual progression is that Indian per capita PPP GDP growth has shown an accelerating trend. This is more easily seen in the following figure:
This is further demonstrated by looking at average per capita PPP GDP growth per administration:
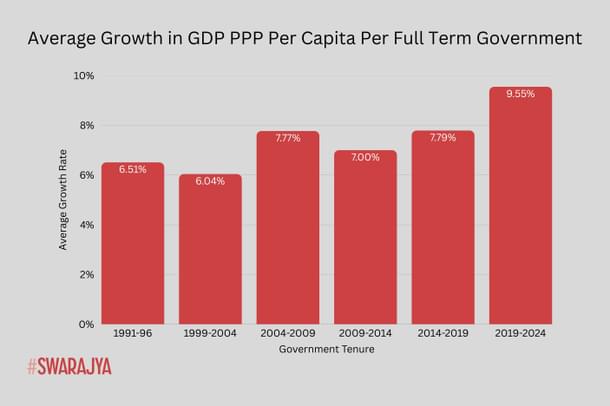
Note that this is per capita purchasing power growth. This is distinct from the general GDP growth data in that it depends inversely on two parameters - population growth and inflation. While India has seen higher real GDP growth rates, the combination of lower population growth - Indian total fertility rate (TFR) is now below replacement rate - and lower inflation boosted per-capita purchasing power. This accelerating trend is even more visible in this chart:
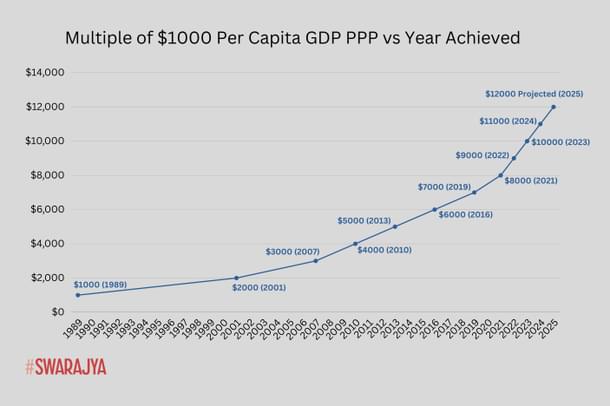
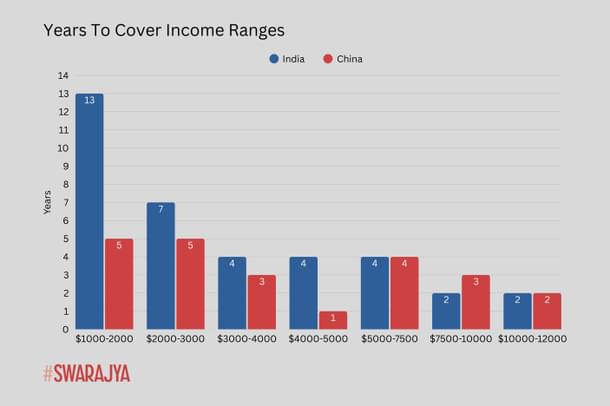
While it took India thirteen years to go from $1000 to $2000 in per capita PPP GDP, it took a year to cover thousand dollar increments from $8050 per capita PPP GDP in 2021 to $12000 in 2025.
The above data presents a fascinating picture when compared against the performance of China across this same income range. Let us take a look at their growth picture first:
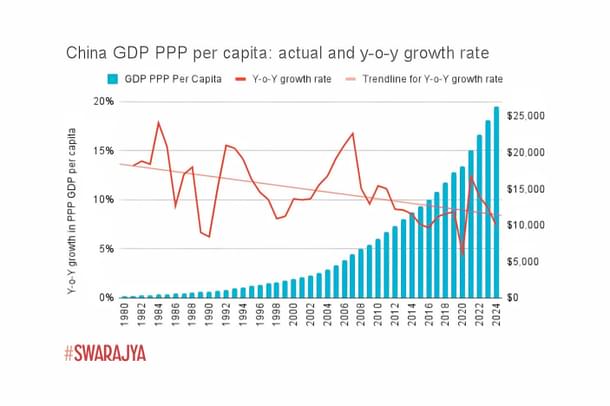
Chinese growth is characterized by far greater per capita purchasing power growth at lower incomes than India could ever sustain. However, as it grows richer, their trendline continues to fall. Meanwhile India demonstrated an accelerating trend - as it grows richer, it is increasing purchasing power at a faster rate. This is more clearly visible in this graph:
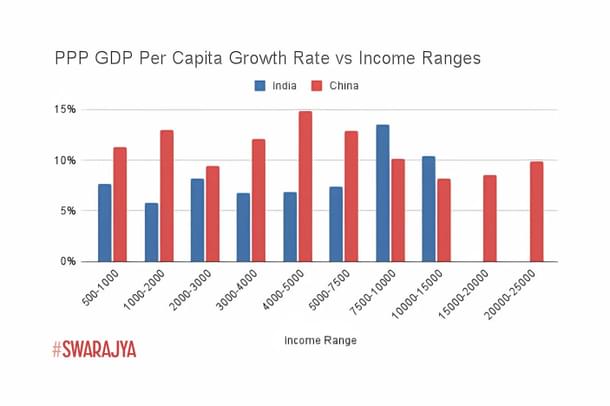
In effect, since hitting $7500 per capita PPP GDP, India has shown faster annual growth than China in this measure. Viewed in another way, India has shown at-par or better rate of traversal of income ranges as it has grown richer than China has, while the latter performed far better at lower income ranges:
This view of Indian economic growth is not commonly known, but it’s a reflection of just how far Indian socio-economic progress on a per capita basis has come in the past decade. Here’s Indian decadal per capita PPP GDP growth benchmarked against the best performing large ASEAN countries:
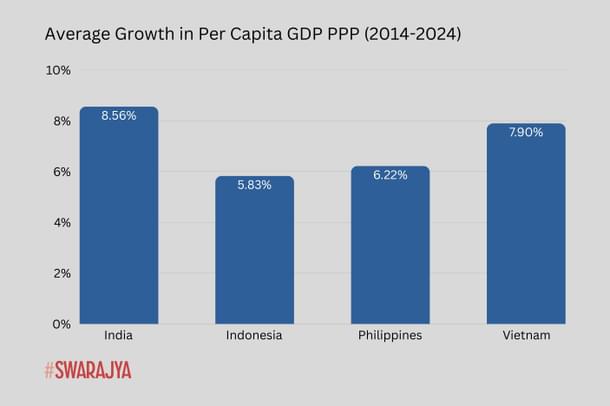
Given the differential in growth rates, India will overtake Philippines in per capita PPP GDP within the next year and will likely catch up with Indonesia, which is at $17000 to India’s $12000, around the end of the decade. At between $18000-22000 per capita PPP GDP, India will overtake the first couple of European countries - Kosovo, Moldova and Ukraine.
How does it compare to the subcontinent ? In its near neighborhood, the simple reality is this - SAARC is the most lopsided regional organization on the planet. It is visible in this chart:
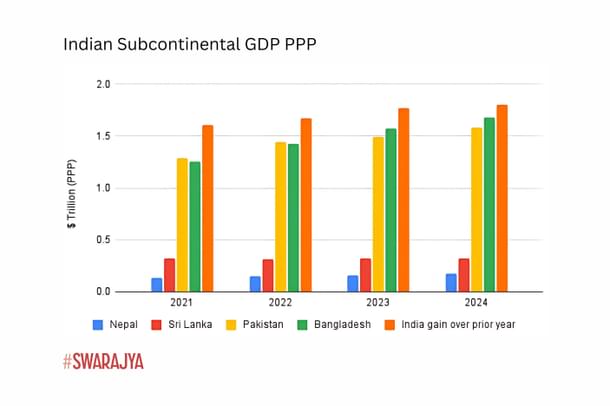
India adds 5 Sri Lankas or approximately 1.1x to 1.2x Bangladesh or Pakistanis economies to its economy every year. Note that the Indian data is the incremental GDP added each year. For all others, it is the total size of their economies.
There is no other regional body where one member adds more than the total sizes of every other country in that organization to its own economy every year. In fact India adds almost an entire SAARC to its economy every two years. Maharashtra alone is a much larger economy than any SAARC country. By 2030, Tamil Nadu, Uttar Pradesh, Gujarat and Karnataka will also have larger economies.
India adds more electrical installed capacity each year than the total installed capacity of Bangladesh or Pakistan. It produces more steel annually - 150 million tons - than all steel ever produced in Pakistan or Bangladesh in all of their history. In comparison, even NAFTA is less lopsided - Canada and Mexico are industrialized nations.
Conclusion
Economic growth in India has a tumultuous history. Unlike China’s stellar ability to marshall its advantages and human capital from a very low per capita income level, India struggled to achieve the necessary political consensus and policy balance between growth and equity while trying to also fix its deficient human capital.
The good news however - is that over the past decade it has hit several milestones. It achieved total electrification by 2020 - almost twenty years behind China. It almost entirely eliminated absolute poverty.
Between the 2014 and 2025, it traversed the entire range from low HDI to high HDI today. The most notable result is that these wins are resulting in faster per capita PPP GDP growth rate - not just benchmarked against prior Indian performance, but better than the ASEAN,equal to or better even than China at this income level.
While enormous challenges remain, the cold data driven view here is that substantial success - as benchmarked against the fastest growing economies - has also been accomplished.
Get Swarajya in your inbox.
Magazine