Economy
Think The Indian Growth Story Is Skewed In Favour Of The Rich? You May Be Wrong
Karan Bhasin
Oct 23, 2019, 09:49 AM | Updated 09:49 AM IST
Save & read from anywhere!
Bookmark stories for easy access on any device or the Swarajya app.


The Central Bureau of Direct Taxes (CBDT) recently released their data for direct tax collections for the financial year 2018-19. The data was of interest as this was the third tax assessment report to be released by CBDT post-demonetization.
The growth in tax collections, buoyancy and other such statistics will be computed, discussed and debated over the coming weeks.
These reports have a distribution of taxpayers, the sum of total income and average income across different income slabs.
The caveat here is that this distribution covers only the formal sector taxpaying employees, which is a very small number compared to India’s overall population.
However, the data can be used to look at the extent of upward mobility in India’s formal sector. The only caveat here is that one can’t compare the 2016 figures with post-2016 on account of demonetization.
However, with certain adjustments, one can obtain a slightly longer series of this distribution for a robust analysis.
There is absolutely no doubt that tax compliance has improved post- demonetization. For those who’re interested to read more on this, please click here to read a joint paper with Dr Srinivas Thiruvadanthai that explored this issue in greater detail.
Some amount of this improved tax compliance must be reflected in the increase in the number of taxpayers at the higher end of the tax slabs.
The important question is, if such an improvement would persist in financial year 2017 and 2018.
What we know from the recently released CBDT data is that there has been a definite increase in the number of taxpayers across the range.
The increase may be on account of improved compliance or new people being added in the workforce.
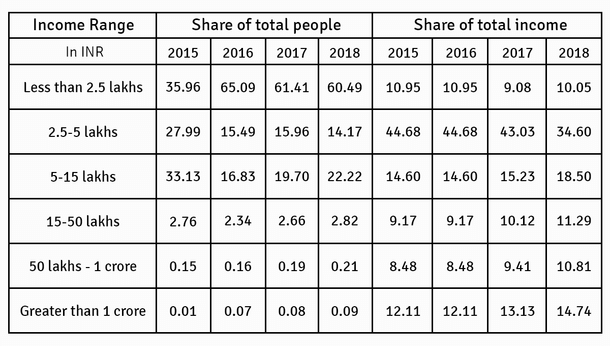
The data on the share of total people per category reveals an interesting story. It is worth noting that the share of people with an income greater than Rs 1 crore has increased substantially in 2016 and similarly, there’s a substantial increase in the number of people with income less than 2.5 lakhs compared to 2015.
This shows how the impact of demonetization has been felt on the tail of the distribution.
Very likely, people have gradually reported a higher income in 2016 and this is reflected in the tails- that is, the less than 2.5 lakh group and the greater than 1 crore group.
People may argue that the changes in the relative shares could well be because of greater compliance post-demonetization.
However, the changes in shares of total people and of total income are relatively modest between 2016 and 2017, thereby suggesting that a bulk of the impact on compliance was captured in 2016 itself.
There may be some compliance-induced impact that may continue to persist; however, it will be miniscule, given that we’re comparing shares instead of absolute numbers.
This means that the overall increase in number of taxpayers combined with a greater number of taxpayers reporting a higher income suggests dynamism and upward mobility in the economy.
Since 2017, we’ve seen a gradual reduction in the share of total people with income less than Rs 2.5 lakh. Interestingly, despite this decrease in the number of people in the category, its share of total income has marginally gone up in 2018.
This suggests that at the average (and aggregate) income at lower levels of income range increased in 2018.
Another important finding is that there’s an increase in the share total income for those with incomes greater than Rs 5 lakh and this increase has coincided with an increase in the share of people in this age-group.
This means that more people are on an average earning a higher level of income than before, thereby revealing the inclusive nature of India’s growth.

Though, CBDT’s data has a very small representation of our overall economy, however, it can be viewed as an important indicator (or at least a proxy) of dynamism in the Indian economy.
While many believe India’s growth story to be skewed in favour of the rich, data reveals just the exact opposite.
The fact that a lower-middle class household can gradually move up to the middle class category and beyond to upper middle-class, seems to be true in the context of India.
The progressive increase in the share of the total number of taxpayers and the share of total income is an indicator of the broad distribution of wealth across the country.
This, combined with the fact that several poverty estimates show absolute poverty in India to be in single digits (as per the current Tendulkar poverty line) reveals the strength of India’s growth story.


