Election 2012
Andhra Pradesh Opinion Poll
Chinmay Krovvidi
Jan 23, 2013, 04:32 PM | Updated Apr 29, 2016, 01:54 PM IST
Save & read from anywhere!
Bookmark stories for easy access on any device or the Swarajya app.
Vote share and Seat Projection – Rayalaseema | ||
| Party | Region Rayalaseema Total seats-51 Seat share | Vote share (in percentage%) 2012 |
| Congress-I | 7 | 24% |
| TDP | 5 | 22% |
| YSR Congress | 39 | 42% |
Vote share and Seat Projection – North Andhra
Party | Region North Andhra Total seats-34 Seat share | Vote Share (in percentage%) 2012 |
Congress-I | 12 | 29% |
TDP | 09 | 28% |
YSR Congress | 11 | 31% |
Vote share and Seat Projection – Dakshina & Coastal Andhra
Party | Region Dakshina & Coastal Andhra Total seats-89 Seat share | Vote Share (in percentage%) 2012 |
| Congress-I | 18 | 26% |
| TDP | 15 | 24% |
| YSR Congress | 54 | 38% |
Vote share and Seat Projection – Telangana(excluding Greater Hyderabad)
| Party | Region Telangana(excluding Greater Hyderabad) Total seats-95 | Votes share (in per centage%) 2012 |
| TRS | 48 | 35% |
| Congress-I | 15 | 18% |
| TDP | 14 | 20% |
| YSR Congress | 9 | 11% |
| BJP | 2 | 7% |
Vote share and Seat Projection – Greater Hyderabad (including Hyderabad & Ranga Reddy districts)
Party | Region Greater Hyderabad (including Hyderabad & Ranga Reddy districts) Total seats-24 | Vote share (in percentage%) 2012 |
Congress | 3 | 12% |
TDP | 5 | 16% |
YSR Congress | 1 | 9% |
MIM | 10 | 19% |
TRS | 2 | 9% |
BJP | 3 | 15% |
Vote share of parties
| Party | Vote share In 2013 | Vote share in 2009 (ECI data) | Change (from 2009 to 2012) |
| Congress-I | 22% | 36.56% | -14.56% |
| TDP | 21.9% | 28.12% | -6.22% |
| YSR Congress | 34.4% | – | +34.4% |
| TRS | 9.7% | 3.99% | +5.71% |
| BJP | 4.3% | 2.84% | +1.48% |
| MIM | 2.1% | 0.83% | +0.44% |
| PRP | – | 16.22% | – |
| others | 5.6% | 12.1% | -6.5% |
Vote share of parties
| Party | Vote share in 2009 | Vote share in 2013 | change |
| Congress-I+PRP | 52.78% | 22% | -30.78% |
| TDP | 28.12% | 21.9% | -6.22% |
~There is a whopping 30% decline in combined voteshare of Congress and PRP which merged into Congress,while main opposition TDP too has seen a decline of 6% in its vote share compared to 2009
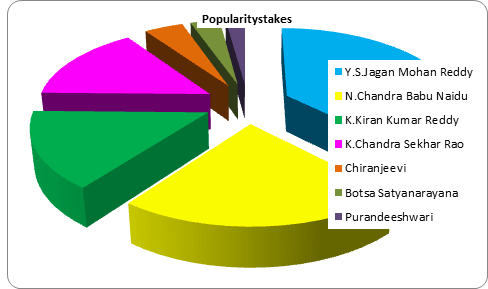
Who would you prefer as Chief Minister of Andhra Pradesh?
| Name | Popularity | Party |
| Y.S.Jagan Mohan Reddy | 35% | YSR Congress |
| N.Chandra Babu Naidu | 21% | TDP |
| K.Kiran Kumar Reddy | 14% | Congress |
| K.Chandra Sekhar Rao | 14% | TRS |
| Chiranjeevi | 4% | Congress |
| Botsa Satyanarayana | 3% | Congress |
| Purandeeshwari | 2% | Congress |
*It is to be noted that the preference for KCR is for the leadership of separate state and not for the state of Andhra Pradesh as a whole.
Are you satisfied with the performance of state government?
Satisfied | 23% |
| Not satisfied | 52% |
How is the performance of Chief Minister Kiran Kumar Reddy?
| Good | 18% |
| Average | 21% |
| Poor | 43% |
Who would you prefer to lead the Congress party?
| Name | Congress voters | Others |
| K.Kiran Kumar Reddy | 31% | 26% |
| Jaipal Reddy | 3% | 3% |
| Botsa Satyanarayana | 7% | 4% |
| Chiranjeevi | 8% | 5% |
| Purandheeswari | 4% | 4% |
What is the most critical issue affecting you in the state?
Price Rise | 31% |
Power crisis | 16% |
Lack of basic amenities | 16% |
Unemployment | 11% |
Corruption | 8% |
How is the performance of main opposition TDP in the state?
Good | 17% |
Average | 27% |
Poor | 33% |
What is the reason for your preference for YSRCP?
Welfare schemes | 28% |
Sympathy factor for YSR | 21% |
Is young | 9% |
Want new alternative | 8% |
Political preferences of various social groups in Seemandhra regions
| Social group | Congress | TDP | YSRCP |
| Rural women | 20% | 19% | 36% |
| Youth | 17% | 22% | 34% |
| Urban voters | 18% | 26% | 28% |
Political preferences of social groups in Telangana
| Social Group | Congress | TDP | TRS |
| Rural Women | 19% | 18% | 25% |
| Youth | 16% | 18% | 33% |
| Urban voters | 16% | 21% | 29% |
Political preferences of various caste groups in AP
| Community name | Congress-I | TDP | YSR Congress | TRS | BJP |
| Reddys | 15% | 6% | 61% | 6% | 5% |
| Khammas | 25% | 49% | 9% | 3% | 3% |
| Kapu/balija | 29% | 18% | 21% | 3% | 4% |
| Other Backward classes | 16% | 30%% | 15% | 18% | 9% |
| Malas | 20% | 5% | 64% | 3% | 2% |
| Madigas | 16% | 23% | 13% | 21% | 5% |
| Other upper castes | 21% | 15% | 26% | 12% | 9% |
Political preference of Muslims
| Community | Congress | TDP | YSR Congress | TRS | Others |
Muslims | 16% | 12% | 41% | 14% | 16% |
Are welfare schemes being implemented properly in the state?
Yes | 24% |
No | 46% |
Who do you think should be credited for the implementation of welfare schemes in the state?
Congress | 21% |
YSR | 59% |
~
Get Swarajya in your inbox.
Magazine