Ideas
Updated Data For 12 States Shows No Spike In Covid Deaths In First Wave, But...
Anand Sridharan
Jun 30, 2021, 03:18 PM | Updated 03:18 PM IST
Save & read from anywhere!
Bookmark stories for easy access on any device or the Swarajya app.


Enterprising journalists have done a commendable job of extracting data from our civil registration systems (CRS) across multiple states.
This has shifted the discourse from unreliable anecdotes to robust data, furthering our understanding of Covid’s impact.
While a larger part of the analysis has focussed on the second wave, that exercise is constrained by incomplete information. Less attention has been paid to studying how India did during the first wave using the same data.
This article reviews all publicly available data pertaining to the first wave, to gauge how India’s deaths trended during that phase.
2020 deaths seem in line with trend
For 2020, CRS death-registration data is available for 12 states that cumulatively accounted for 72 per cent of India’s registered deaths in 2019. The following table shows growth in registered-deaths in 2020 compared to historic growth over 2009-19.
This allows the first wave to be viewed against long-run trends and variations in trend, to make sound inferences.
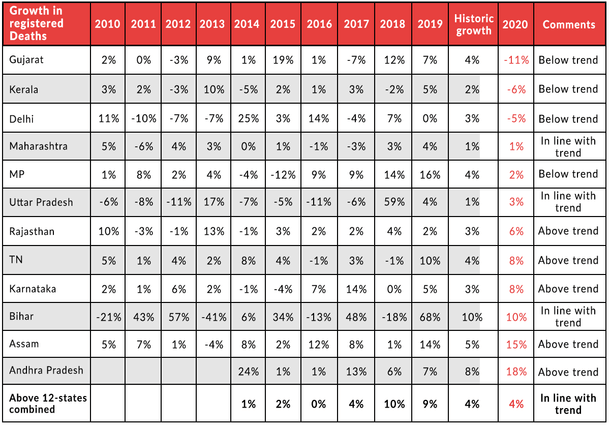
Before getting into nuances, what’s the gist? Aggregate registered-death growth of 4 per cent in 2020 across 12 states is in line with 2013-2019 growth rate of 4 per cent a year.
If Andhra Pradesh is excluded (since it limits historical comparisons to 2013 onward), 2020 growth for the remaining 11 states is also in line with 2009-19 trend growth of 3 per cent a year.
2018 and 2019 witnessed higher growth in deaths than 2020.
While we can come up with theories for outlier states, it’s worth noting that every year has three to five states that show high growth. For 11 of the 12 states, 2020 is not the worst increase on record (except Assam, where the 15 per cent increase in 2020 is slightly higher than the 14 per cent in 2019).
However, before drawing any definitive conclusions, we should go through a few pitfalls pertaining to data and reasoning.
Data inconsistencies
Why did I only show growth rates and not the absolute number of deaths in 2020?
For every state, the source for 2020 data also mentions numbers for 2018 or 2019. These simply do not match numbers from the official CRS-2019 report.
This is not about media unreliability, as official state government communications also show similar discrepancies. Kerala’s official note has 2015-19 data that is (slightly) different from the CRS-2019 report.
Kerala’s 2020 figures also increased by 6 per cent between the initial state government note and recent media reports (I used the higher number).
Rajasthan mentions a figure for 2019 that is 12 per cent lower than in CRS-2019. The Tamil Nadu government’s CRS data doesn’t tally with central CRS data for either 2018 or 2019.
The state’s CRS shows an incredibly high 16 per cent growth for pre-Covid 2019. Media data for Madhya Pradesh, Tamil Nadu, Andhra Pradesh and Bihar do not match CRS data for 2018 or 2019.
For Uttar Pradesh, media-sourced data places 2019 deaths 18 per cent lower than CRS-2019.
Only Gujarat and Karnataka data seem to match for 2019. In an exercise where excess deaths are derived using small deviations from noisy trends, such inconsistencies add to uncertainty and imprecision.
At a granular level, inconsistencies increase. Bihar had a spike in deaths only in December 2020, months after the first wave peaked. This differs from other states that witnessed above-trend deaths somewhere between July and October.
Assam witnessed 20 per cent growth in January-March 2020 (pre-Covid) and 13 per cent growth in April-December (first wave), suggesting that a part of the increase may just be an improvement in the registration system.
My best guess is that discrepancies are due to delays in logging data, period-end reconciliations, eliminating duplicate entries, definitional issues (applied vs approved) etc.
Taking 2019 data from one source (ie, CRS-2019) and 2020 data from another (i.e. media) leads to comparisons that aren’t like-to-like. It also makes it possible for me to cheat, by cherry-picking a data-pair that best suits my biases.
So, in each case, I have taken 2019 and 2020 data from the same source, to calculate like-to-like growth rate (which is shown in the above table). Wherever there was ambiguity, I have erred on the side of using a higher number for 2020 growth.
For calculating averages across states, I have weighted growth rates by CRS-2019 registered deaths.
Subjective inferences
“1,42,143 excess deaths in TN”. Precise headlines have become commonplace, as if they are indisputable fact. Excess deaths are poorly defined and subjectively estimated. Excess deaths actually mean above-trend deaths.
But the trend is ambiguous. It depends on the period of reference. Past trend need not be representative of future years. If most years deviate from trend, determining whether 2020 is deviant is dicey.
By how much is dicier.
In Assam, decadal growth is 5 per cent a year. If anything above this is ‘excess’, Assam witnessed excess deaths in four of six years preceding Covid.
This is evidently absurd, as excess cannot be the norm. It is highly likely that Assam’s trend growth in death registrations is closer to 10 per cent, in the light of 9 per cent growth over 2015-19 and 20 per cent growth in early-2020.
In Tamil Nadu and Bihar, what is one to make of 2019 growth being higher than 2020? If we attribute 2020 excess deaths to Covid, what caused greater ‘excess’ in prior years?
In every state with above-trend deaths, excess deaths are a subjective estimate, not ordained fact. Reasonable people can disagree here.
Why ramble about unreliability of data and ambiguity in method? It’s a statutory warning to not take headlines or precise large numbers seriously. Note that I am logging confounding issues pertaining to 2020, which is firmly in the rear-view mirror.
More confident folks are making sensationally precise estimates for mid-2021, pertaining to an ongoing wave. Admitting that “it’s complicated” or discussing error-bands interferes with eye-catching headlines.
From what I have observed, headlined numbers can easily change by 50 per cent with small (and not unreasonable) tweaks in approach.
As a general guideline, do not ignore input data presented in media reports. But, do ignore estimates (including mine).
It’s best to use data, in conjunction with historic trends, to make an independent assessment. I prefer my own mistakes and biases to that of others.
What about remaining states?
State-wide data is unavailable for 2020 outside of these 12 states. Some city-level data is available. Hyderabad and Kolkata deaths grew 17 per cent and 7 per cent respectively over 2019.
However, cities can be unrepresentative of states. In 2020, Bangalore deaths grew 27 per cent while Karnataka deaths grew at a way lower 8 per cent. Similarly, Chennai deaths grew 12 per cent while the state grew 8 per cent.
Mumbai grew 23 per cent while Maharashtra grew 1 per cent. Hyderabad’s historic growth of 10 per cent a year over 2016-19 is way higher than Telangana’s 4 per cent.
Perhaps, cities serving as medical hubs distorted trends. Whatever the reason, it doesn’t seem prudent to extrapolate from city-level data.
There is no way to precisely know how the remaining 28 per cent of India did in 2020. There are unreliable straws in the wind. Kolkata data hints that West Bengal’s death data may not have been too elevated.
States like Odisha and Jharkhand seem to have done better than most even in the second wave, making them unlikely candidates for excess deaths in the first wave.
However, serious analysis cannot be based on such speculations.
For that, I can think of two approaches. First, 72 per cent of India is closer to universe than to a sample.
While it may not be perfectly representative, it is our best available estimate for how all of India did. Second, use what-if scenarios for the remainder. If the remaining 28 per cent of India witnessed deaths 5 per cent above trend (i.e., 8-10 per cent growth in deaths over 2019), that is over 100,000 excess deaths (5 per cent of around 2 million).
With India reporting 150,000 Covid deaths over 2020, this is not indicative of an elevated undercount.
The rest of India will have to do way worse for such claims to hold, something not backed by available first-wave evidence.
Early-2021 was similar to 2020
While it is hard to put precise start/end dates on pandemic waves, the first wave did not end when 2020 ended. The early part of 2021 marked the tail end of the first wave.
For 2021, month-wise death data is available for six states (TN, Karnataka, AP, Bihar, Kerala, MP).
January-March monthly deaths over these six states are 6 per cent above the 2019 average, which is roughly consistent with trend growth over a two-year period.
This does not suggest elevated excess deaths during the latter part of the first-wave either.
First-wave summary
All things considered, India’s all-cause mortality was roughly in line with historic trend during Covid first wave.
This is not suggestive of elevated excess deaths or Covid death undercounts. As I have written earlier, this does not equate to no undercount at all.
Even the West, with better systems, estimates at least 1.5x undercount. Let’s just say, outside of inherently unavoidable undercounts, India’s Covid reporting seems reasonable in the first wave.
At the least, excess death analysis doesn’t offer a path to finding undercounts. With India recording 160,000 Covid deaths till March 2021, ‘true’ first-wave death toll could be somewhat higher but not way higher. That is about as precise as we can get in our messy world.
Implications for second-wave analysis
The above analysis offers a template for analysing the second-wave. The idea is to frame all available evidence against historical trends/variations and cautiously estimate above-trend deaths.
First-wave analysis also guides us on where to focus. Since deaths were consistent with prior trends till early 2021, the entire ‘massive undercount’ debate is limited to a three-month period (April-May-June 2021).
Over any three months of 2021, India is expected to witness over two million registered deaths, as per trend. The question now becomes, how many additional deaths were witnessed in April-May-June due to the direct and indirect impact of Covid.
For a reliable answer, it makes sense to wait for June data. It’s imprudent to leave out one of three months of interest. Also, given inconsistencies in data from prior year, data from prior month(s) will be even more patchy and buggy.
Analysis needs to be more careful and inferences more guarded. It will be a tentative estimate, pending validation via formal 2021 statistics. Until then, it is best to not take headlined estimates at face value.
Get Swarajya in your inbox.
Magazine