Lite
Waste Getting Out Of Hand, Cities Getting Filthier
Swarajya Staff
Oct 08, 2015, 12:05 AM | Updated Feb 11, 2016, 09:00 AM IST
Save & read from anywhere!
Bookmark stories for easy access on any device or the Swarajya app.


The alarming rate of waste generation over the past 10 years in the five most populated cities of India.
The chart below illustrates the sheer extent of the problem of waste management in India. In the decade between 2001-11, all the mega-cities of India, except Kolkata, generated waste at a rate higher than the rate of increase in their respective populations.
This led to a state where Delhi, for example, generated an average of 6800 tonnes of waste everyday in 2010-11. Mumbai wasn’t far behind either. Refer to the graph below for data on all the five cities.
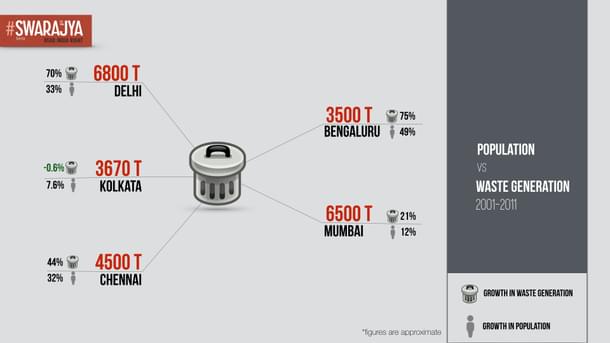
Figures in red are average waste generated per day for 2010-11
Source: Central Pollution Control Board and BBMP documents
Get Swarajya in your inbox.
Magazine