Politics
Data Story: Gujarat Mortality Rates Are Much Lower In The Second Wave
Venu Gopal Narayanan
Apr 20, 2021, 02:18 PM | Updated 02:18 PM IST
Save & read from anywhere!
Bookmark stories for easy access on any device or the Swarajya app.


There has been some sustained commentary in the media of late, about a supposedly-abnormal heightening of death rates in Gujarat, during this second wave of the Wuhan virus.
This has led to frenzied WhatsApp forwards and some alarm, particularly among those in other states, whose family members reside in Gujarat in large numbers.
While the situation in Gujarat is indeed grim, and health services are stretched to the limit, Swarajya’s analyses of epidemic data show, to the contrary, that such alarm is unfounded: the state’s mortality rates during the ongoing second wave are, in fact, lower than they were in 2020.
This is the historical epidemic data for Gujarat:
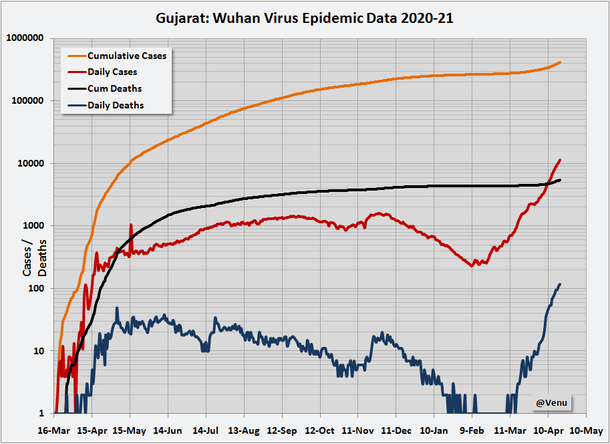
As we can see from the red, daily cases line in the chart above, the second wave began in Gujarat on 9 February 2021. This was followed about four weeks later by a rise of the blue, daily deaths curve.
The mortality rate in Gujarat was initially high in 2020 because a large number of cases were not being reported, mainly due to inadequate testing. But once the state ramped up its testing levels adequately, the mortality rate began to decline consistently:
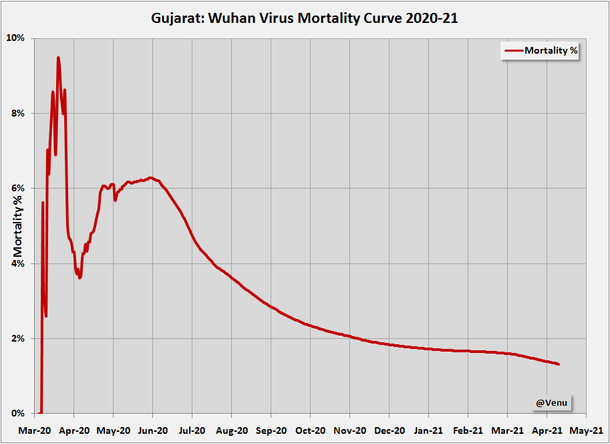
In fact, as the red line in the second chart above shows, the mortality rate has actually declined further, since the onset of the second wave in early February 2021.
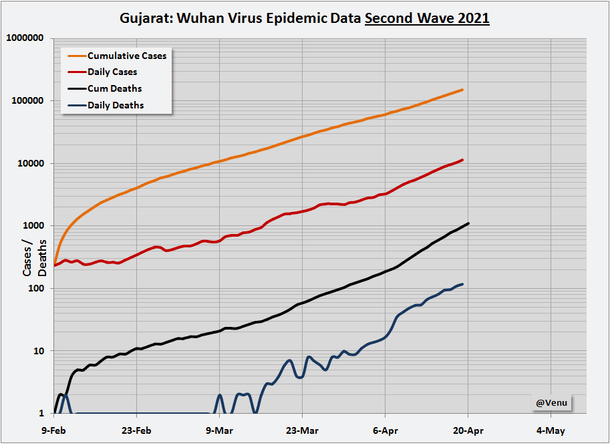
But that still doesn’t answer the specific question of what the mortality rates in the second wave are. For this, the data of the second wave was segregated from the first wave, and analysed independently. Its historical plot, with a start point of 9 February, looks like this:
Now, when we calculate mortality rates for the second wave separately, and compare them with the values of the first wave, we see that mortality rates are in fact lower than before:
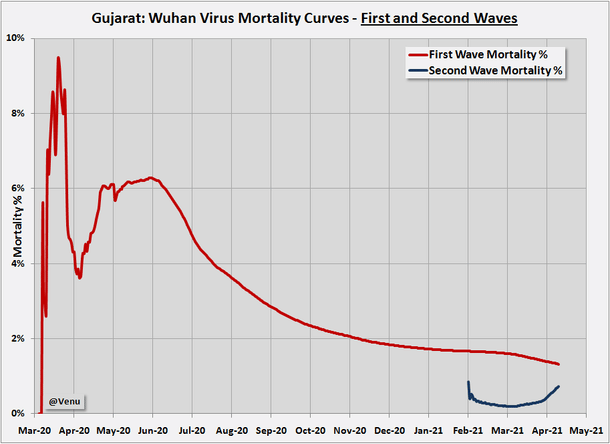
As readers would note, the blue curve of the second wave lies well below the first. It does exhibit a rising trend since early April 2021, but as the red, historical curve shows, this upward trend will reverse into a downward decline in about four to five weeks. And that trend will still be well below the peak trends of the first wave.
Yet still, the narrative runs strong, and innovative plots have been generated to try and show that things are worse than we think. Some publications have chosen to analyse mortality by subtracting active cases from the total tally, and plotting deaths against recoveries plus deaths; they call it ‘adjusted case fatality rate’ or A-CFR.
Swarajya generated its own A-CFR plots for Gujarat, to test this visualisation. It was seen that such a selective plot would naturally accentuate a relative rise in the death ratio when recovery rates go down (because the denominator is smaller, since active cases have been subtracted from the total).
But an adjusted CFR plot is only a partially-representative transitory indicator, which highlights short term trends, and is not a substitute for cumulative mortality curves. This is because logic dictates that a mortality rate can’t be arbitrarily calculated by arbitrarily subtracting a segment – in this case, active cases – which is a subset of the principal category; that is, total cases including active ones, recoveries and deaths.
In addition, as we demonstrate below, the A-CFR curve will, in any case, start dipping sharply downwards once the peak passes; and besides, the variation between A-CFR and mortality curves is anyway only in decimal places. This is but natural, since the magnified trends of an A-CFR curve will become increasingly muted, and its values will reduce, as recoveries rise.
For confirmation, Swarajya generated separate A-CFR plots for the first and second waves, and observed that the A-CFR curve of the second wave indeed lay below that of the first:
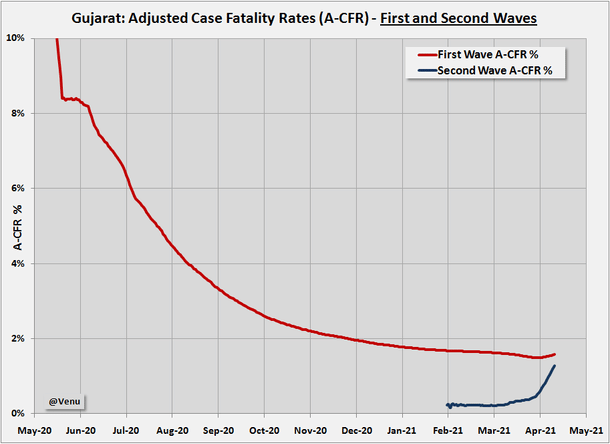
Note how the A-CFR of the first wave (red curve) fell by two whole percentage points in about a week in June 2020, when numbers stabilised.
Thus, the conclusion is that while the epidemic is still raging in Gujarat, mortality rates of the second wave are mercifully lower than that of the first one. This may in fact be an indirect indicator that our vaccines are working.
All data from Covid19india.org
Venu Gopal Narayanan is an independent upstream petroleum consultant who focuses on energy, geopolitics, current affairs and electoral arithmetic. He tweets at @ideorogue.
Get Swarajya in your inbox.
Magazine