Politics
Vajpayee’s SSA Vs Sonia’s RTE: A Comparison Of Trends In School Enrolment Under Both Schemes
Hariprasad
Mar 20, 2018, 05:45 PM | Updated 05:45 PM IST
Save & read from anywhere!
Bookmark stories for easy access on any device or the Swarajya app.
On 12 March 2018, the following question was asked in Lok Sabha during Question Hour.
UNSTARRED QUESTION NO. 2702
Will the Minister of HUMAN RESOURCE DEVELOPMENT be pleased to state:
(a) whether it is a fact that rate of admission in schools has increased in the wake of implementation of the Right to Education Act, 2009 in the country and if so, the details thereof;
In response, the Ministry of Human Resource Development said:
Yes, Madam. The Right of Children to Free and Compulsory Education (RTE) Act, 2009, mandates that every child of the age of six to fourteen years shall have the right to free and compulsory education in a neighbourhood school till the completion of his or her elementary education. The Sarva Shiksha Abhiyan (SSA) Programme has been designated as the vehicle for implementing the provisions of RTE Act, 2009. Since inception of SSA in 2001, there has been significant progress in achieving near universal enrolment. As per UDISE 2015-16, enrolment of children in elementary schools has increased from 18.78 crore in 2009-10 to 19.67 crore in 2015-16.
The government is essentially claiming that the Right to Education (RTE) Act has resulted in increasing the enrolment of children in elementary schools. We will attempt here to see if this claim is indeed valid.
The RTE Act, as we all know, was brought into effect in the year 2009. The Act proclaims to guarantee education for every child aged between six and 14 years in the country. It reserves 25 per cent of seats in all schools for Scheduled Caste (SC)/Scheduled Tribes (ST), economically backward class (EBC), and DG groups, except in private schools owned by non-Hindus.
There are many analyses of this Act made from multiple perspectives already. Here, we try to look at some statistics that are central to the goals of RTE Act.
1. Total student enrolment numbers
- The primary school segment is the most important one with respect to enrolment. The benefit of the 25 per cent reservation should be most visible here.
2. Percentage of SC and ST student enrolments
- This number is an indication of the percentage share of seats in schools that the target segments are actually getting.
The source for the numbers below is the District Information System for Education (DISE). The numbers should be valid for us because the Ministry of Human Resource Department itself uses this source as a credible one.
First, let us take a look at student enrolment numbers from the pre-RTE era till 2015-16. The table below shows the enrolment numbers and relative growth rate from 2003-04 to 2015-16. It covers a six-year window before and after the introduction of RTE.
A graph showing the numbers makes clear how enrolment numbers have actually started declining steadily in the RTE era as compared to the years during which the Sarva Shiksha Abhiyan-led initiative was the key policy in the education arena.
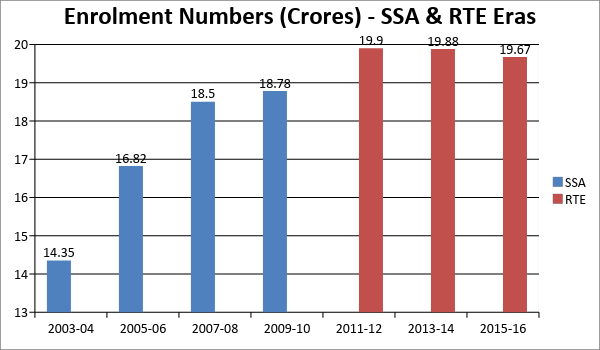
Prior to 2009, enrolment numbers grew at a much higher pace than what has been possible after 2009. A look at the aggregate growth rate for the six-year block before and after the introduction of RTE helps visualize the data better.
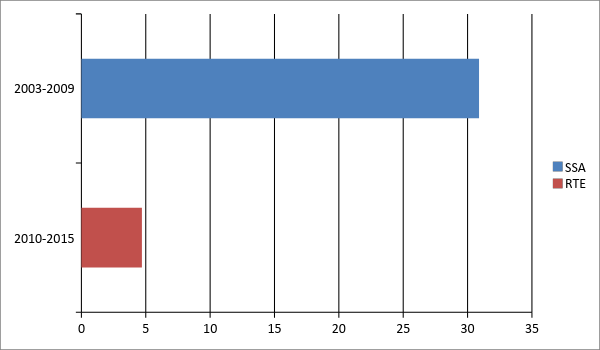
Enrolment Growth Rate
Some observations from the two charts:
- Prior to the introduction of RTE, due to the Sarva Shiksha Abhiyan initiative alone, the enrolment rate grew at an outstanding 30 per cent rate between 2003 and 2009.
- The enrolment rate did taper down a bit towards 2009. The introduction of RTE in 2009 provided a mild boost for enrolment in the first two years, when the growth rate increased from 1.5 per cent to 5.95 per cent.
- However, once exemptions from RTE were granted to aided minority institutions in 2012, and to unaided minority institutions in 2014, enrolment rates have declined.
Even without these numbers, the effect of RTE on school capacity can be deduced easily.
- Demand for government schools is declining rapidly in the country. RTE does not impose any serious quality requirements on government schools, thereby making them even less attractive.
- Due to stringent requirements, numerous majority-owned budget schools are being forced to close down.
- Due to the constitutional protection, both aided and unaided minority schools are exempt from RTE. The number of schools claiming exemption is increasing year on year.
- Due to the draconian nature of the provisions under RTE, establishment of new schools, especially budget schools, has been disincentivised.
The net effect of these factors means only one thing – an increasing capacity problem in our primary schools. The numbers in the tables only confirm that this capacity problem has already started to take effect.
Now, let us look at one more piece of data that could throw light on whether RTE is having a positive effect on at least the children of the target sections of society – the SCs and STs.
The DISE provides data on the enrolment percentage of kids from classes I to VII, who belong to the SC and ST communities. Here are the percentages for every alternate year from 2003 to 2015.
Clearly, there has been stagnation of enrolment percentages for these two communities in spite of a special provision in the RTE Act that entitles them for up to 25 per cent of seats in private schools. While it is difficult to get into the details of the split-up, in terms of the nature of school and level of enrolment of these communities, it is certainly clear that at the gross level, RTE has had no success in increasing the relative enrolment ratio of SC and ST children.
The intention behind carving out a reservation in seats for these communities was the obvious assumption that many children from these communities were being denied the opportunity to enroll in schools and that that issue could be fixed by explicitly blocking seats for them – even if it meant a reduced capacity for children from other communities. RTE has failed in achieving this goal too.
The RTE Act has failed to accomplish even the most basic of goals that it set out for itself. It is time to have a serious review of the Act and undertake some course correction at the policy level itself. Otherwise, the slide downwards may continue further, leading to a disaster in the elementary school education system of this country.


