Politics
The Data Is Clear: UP Has Managed To Control Covid-19 Both In Absolute And Relative Terms
Venu Gopal Narayanan
Sep 28, 2020, 04:45 PM | Updated 04:45 PM IST
Save & read from anywhere!
Bookmark stories for easy access on any device or the Swarajya app.

There’s something about the sheer size of India which causes numbers to cease making sense; one in five people on the planet waves the tricolour.
And within India, Uttar Pradesh dwarfs other states by a factor of two, three, or more.
With 230 million denizens, the heart of the Gangetic plains is a densely habited region, less populous only than China, America and Indonesia.
Compounding that demographic enormity is a public opinion of notorious maladministration, backwardness and underdevelopment, by which, one would have expected UP to wilt under the onslaught of the Wuhan Virus, and become an epidemic basket case.
On the contrary, though, the latest epidemic data shows that this state has not only combated the virus admirably, and rent asunder the misconceptions it suffered for far too long, but actually set an inspiring benchmark as well, on how very large states with limited resources, can still get the job done without a murmur.
Our analyses demonstrate that the UP administration has now successfully managed to bring the epidemic under control, in both absolute and relative terms.
Testing is the highest in the country, the daily rate of testing is consistent, case counts have plateaued and are now into decline, positivity has finally started to reduce, and recovery rates are thankfully set to spike from this week on.
This is the status as on date:
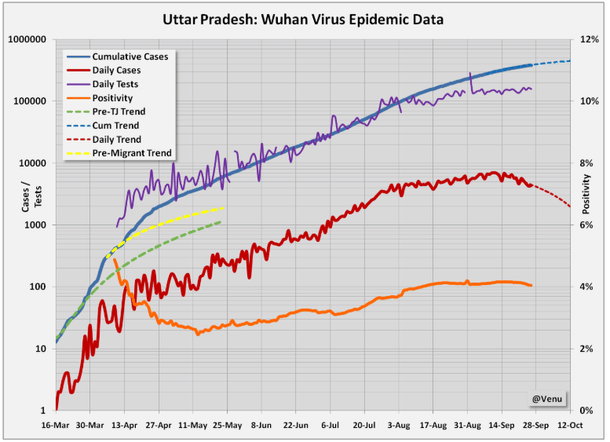
As the dark red case count curve in the chart above shows, cases plateaued towards the end of August, and commenced a consistent decline from mid-September onwards.
This was achieved through a diligent build up of significant testing capacity in every district, so that the virus could be aggressively chased.
The distribution of hotspots shows there was no natural, inhibitory advantage against virus transmission in UP simply because it was a largely rural state; clusters still sprang up everywhere.
Indeed, even though Lucknow and nearby Kanpur have by far the two largest clusters, their combined tally is still under 20 per cent of the state total.
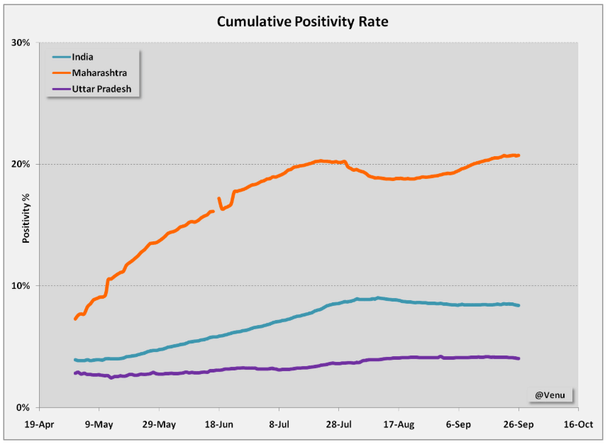
A second key parameter which shows encouraging trends in UP is positivity.
As it is, the overall positivity had remained mercifully low in the state — around 4 per cent; this has now entered a minor decline in the past week.
This points to the successful containment efforts employed, and is depicted by the orange curve in Chart 1 above.
In comparison, the cumulative positivity in Maharashtra is running at a staggering 21 per cent today, and the national average is still over 8 per cent.
Against that, for UP to have kept positivity levels so low for so long, and now, to have instituted a decline, means that the state administration’s efforts at containing the contagion’s spread are working.
Lives are being saved.
Chart 2 below shows this clearly:
A third, equally important parameter is the test positivity rate (TPR) — the ratio of positive cases to samples tested on a given day.
Here too, the UP trends are well below the national trend, as well as that of Maharashtra — and declining.
That means both the number and percentage of new cases is going down on a consistent, daily basis — again, very good news.
The TPR trends are shown in Chart 3 below.

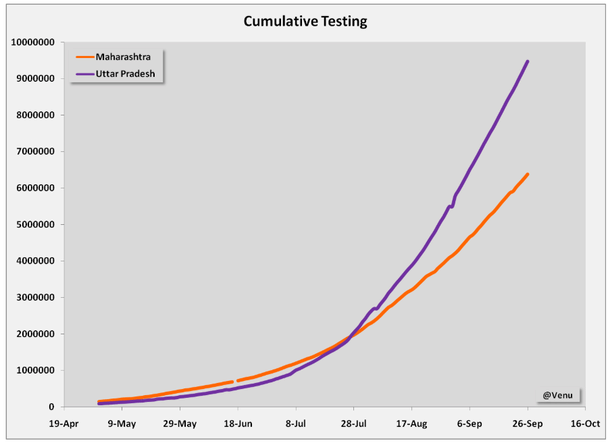
A fourth reason for residents of UP to heave a sigh of relief is the rate at which their state ramped up testing levels.
As Chart 4 below shows, the state managed to get its administrative act together only by mid-July, but once that line was crossed, there has been no looking back.
Importantly, this chart offers two points to Chief Minister Uddhav Thackeray and his government in Maharashtra: one, just how much more efforts they need to put in, if they are to avoid the medical disaster of the century; and second, that if gigantic, unwieldy, relatively less-advanced UP can do it, then surely Mr. Thackeray can too.
In fact, Chart 4 actually serves as an index of administrative efficiency, which the Central government would do well to take urgent note of, as case and positivity trends continue to remain dangerously high in Maharashtra, and testing lags behind:
In addition, recovery rates in UP are at 83 per cent, at par with the national average; these levels are expected to improve further over the coming week, as the declining trend of active cases since mid-September accelerates.
And finally, it must be borne in mind that the situation in UP was contained to what it is today, in spite of three significant setbacks — the concealed Tablighi Jamaat clusters which sprang up without warning in end-March, the disorderly return of migrant workers who were politically instigated to movement during April, and the passage of millions of workers through UP, to states like Bihar and West Bengal and beyond.
These are marked on Chart 1 by yellow and green dashed lines — showing how much lower the cumulative numbers in UP would have been, if only these episodes were avoided.
Nonetheless, we may conclude that UP has managed to contain the epidemic at manageable levels in both absolute and relative terms, in spite of most restrictions having been lifted.
And for a sense of perspective, we may recollect in closing, that UP, with 230 million people, is at under 400,000 cases, while France, Germany and Britain combined (approximately 210 million people) have crossed 1,200,000 cases.
(All data from Covid19india.org)
Venu Gopal Narayanan is an independent upstream petroleum consultant who focuses on energy, geopolitics, current affairs and electoral arithmetic. He tweets at @ideorogue.
Get Swarajya in your inbox.
Magazine