Politics
The Gujarat Election Forecast
Venu Gopal Narayanan
Nov 29, 2022, 03:46 PM | Updated 03:46 PM IST
Save & read from anywhere!
Bookmark stories for easy access on any device or the Swarajya app.
Campaigning for both phases of the Gujarat Assembly elections end this week. That is an apt moment to present Swarajya’s electoral forecast for the state’s legislature.
These forecasts were generated from a proprietary predictor model constructed for Gujarat using historical election data, pre-poll opinion surveys, ground reports, and in-house political assessments.
They are backed up by an in-depth analysis covering all 182 assembly seats.
The methodology employed is uncomplicated and straightforward.
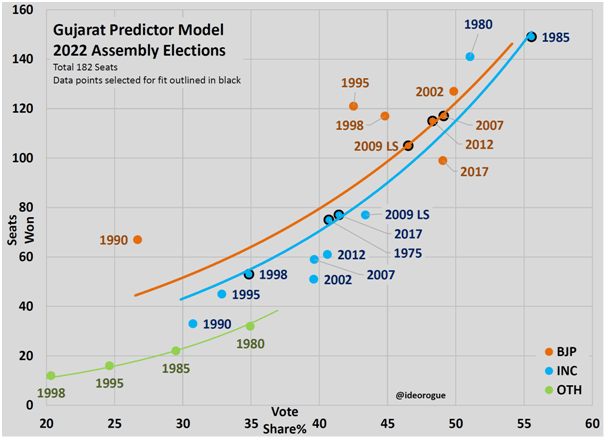
First, a historical cross-plot of seats won versus vote shares was generated for each principal political entity in all assembly elections held in Gujarat from 1975 to 2017 — in this case, the Bharatiya Janata Party (BJP), the Congress, and ‘Others’.
The raw plot is presented below.
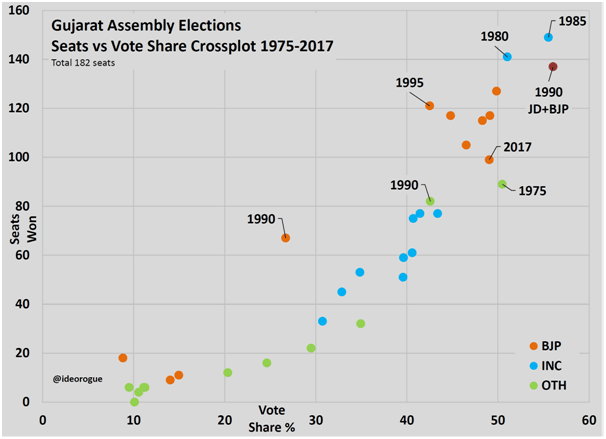
Second, trend curves were established for the BJP, Congress and ‘Others’.
In this process, outlier results were identified, and deselected.
These include, for example, the BJP’s performance in the assembly elections of 1990, 1995, or 2017; the Congress party’s performance in 1990 and 2002; or that of the ‘Others’ in 1975.
The assembly segment data of the 2009 Lok Sabha elections was included because it conforms to trends for all three entities.
The predictor curves generated by this process are shown in a chart below. The colour coding is: orange for the BJP, blue for the Congress, and green for ‘Others’.
Third, the historical electoral data of all 182 assembly seats was analysed minutely, with particular focus on the past two elections of 2012 and 2017 (primarily because a delimitation in 2009 redrew constituency boundaries, to effectively create an electoral reset).
This exercise was then supplemented with electoral and political developments in Gujarat since 2017, including a number of defections and byelections, most of which were to the BJP’s advantage.
The findings of those detailed analyses can be read here, here, here, here, and here.
Fourth, the predictor model was then populated with the results of pre-election opinion poll surveys conducted by leading media houses and polling agencies.
Again, this was done after intense scrutiny and due diligence of such surveys, and the identification of discrepancies within. Analyses of these opinion polls can be read here, here, and here.
Many of the polls did not pass even a basic smell test, and pollsters were duly warned by Swarajya as far back as early September 2022, to up their game if they wished to retain their credibility and be taken seriously.
The principal objections are to three findings in many of the surveys: a reduction in the BJP’s vote share by 4-5 per cent from the 49 per cent it got in 2017, with those votes going entirely to the Aam Aadmi Party (AAP); a decline of the ‘Others’ vote share to a nigh-improbable low of 5-6 per cent; and a forecast that votes will shift from the BJP, Congress, and ‘Others’ to, and only to, the AAP.
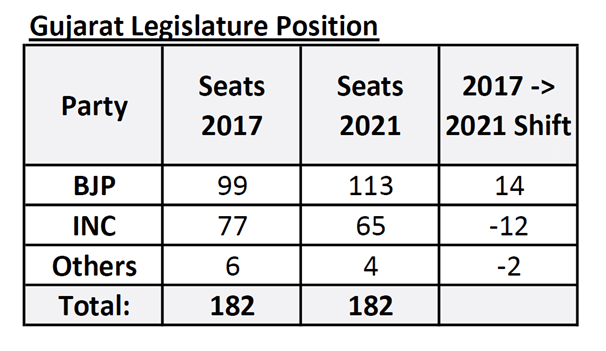
This cannot be, since the BJP’s vote share has already crossed 50 per cent — meaning an increase of 1 per cent from 2017 — on account of wins in numerous by-elections in the period 2018-2021.
Indeed, as a table below shows, the BJP’s seat tally in the state legislature rose by 14 between 2017 and 2021 — two of which were previously held by independents.
If we add the number of defections from the Congress to the BJP by sitting MLAs this year, many of which were solid Congress holds, the BJP’s effective vote share would go up even further.
To that we must also add the withdrawal of candidacies by around half a dozen AAP contestants, the expected win of at least two independents, and the significant polling (but not wins) by independents in at least two dozen seats.
These ground realities and survey incongruities notwithstanding, the polls used in this predictor model are:
· Times Now-ETG survey of 3 November 2022 (TNow)
· Zee 24 Kalak survey of 3 November 2022 (Zee)
· ABP News C-Voter survey of 28 November 2022 (ABP)
Fifth, and finally, the model was populated with Swarajya’s predictions.
Readers may note that this is a base forecast, meaning that the BJP’s seat tally could rise sharply, incommensurate with its predictor curve, if the AAP does cut into Congress votes.
It also means that while the BJP could register a higher vote share, the probability of it reducing to the 45-46 per cent band, as suggested by some surveys, is quite low.
By corollary, and for the same reasons, the number of Congress wins could reduce in a disproportionate manner to a reduction in its vote share (and partly also since nearly two dozen of their wins in 2017 were by extremely narrow margins).
Here is a summary table of the four forecasts:

And this is how the four forecasts plot on the predictor model:
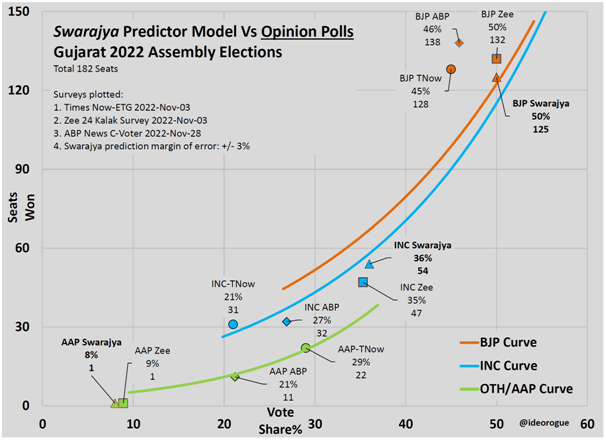
One, the Swarajya and Zee surveys are in close conformance, with Zee being slightly more optimistic for the BJP at the same vote share.
Two, the Times Now and ABP surveys appear to be underestimating the BJP’s vote share (or overestimating the seat tally).
Thus, if one were to transpose these survey vote shares onto the orange BJP predictor curve to make seat conversions, the BJP’s win count would go up to around the 150-160 band.
While that outcome is not beyond the realm of possibility, the two forecasts would still be off because they would still be underestimating the vote shares required for the BJP to hit that mark.
Three, both the Swarajya and Zee surveys may be marginally underestimating the Congress’ vote shares.
In a way, this reinforces an earlier contention that the ‘Others’ vote (separate from that of the AAP) may not fall to the 5-6 per cent band, as the three opinion polls suggest.
If so, then the AAP’s vote share is being overestimated by at least that much.
Four, it is difficult to accept the Times Now and ABP forecasts for the AAP for a simple reason: a seat-wise analysis incorporating local dynamics indicates that the AAP can’t do so well without the Congress doing worse than these surveys project, and, without the BJP doing better (especially in terms of seats).
This being a digital age, it is, of course, possible that the AAP may get a slightly higher vote share, and some more seats, than what Swarajya predicts, but the probability of that is very low.
Also, and this is a qualitative observation, while many are eager and willing to ‘give’ the AAP as many as 22 seats with a 29 per cent vote share, or even more, no one is ready to name those seats for the record — not even the AAP. And thereby hangs a tale.
Consequently, and in conclusion, the greater possibility is that the Gujarat Assembly election results would more likely approximate Swarajya’s predictor model curves.
Whatever the outcome, one of two things is certain to be established on counting day: either a new paradigm will be set in Indian politics — that of a party’s ability to generate a substantial silent wave amongst an electorate, through the digital domain, without an extensive grassroots network, and on the strength of a massive media blitz alone; or, the credibility of those pollsters who predicted 20-plus per cent vote share for the AAP will be shredded, and their reputations will be crucified.
All data from Election Commission of India website.
Venu Gopal Narayanan is an independent upstream petroleum consultant who focuses on energy, geopolitics, current affairs and electoral arithmetic. He tweets at @ideorogue.
